Forex Market Analysis: NZD/USD Strong Buying Power on dips
In the fourth quarter of 2024, New Zealand's unemployment rate climbed to its highest level since the end of 2020, increasing the likelihood of the Reserve Bank of New Zealand (RBNZ) cutting interest rates significantly for the third time in a row later this month. As the domestic interest rate outlook becomes increasingly certain, the NZD/USD trend is still driven by offshore factors, especially risk appetite and sentiment towards the Chinese market.
In the fourth quarter of 2024, the unemployment rate reached 5.1%, the highest level since the end of 2020. Adding underemployed individuals, the underutilization rate of the labor force has increased from 10.7% a year ago to 12.1%, highlighting the increasingly weak labor market.
The number of employed people decreased by 32000, with males accounting for 85% of the decline. The reduction is mainly concentrated in trade and machinery related positions, with a significant decrease in full-time male employment and an increase in part-time positions. The labor force participation rate has dropped from 71.2% three months ago to 71%, partially easing the rise in unemployment rate.
Private sector salary growth has slowed down, with a 0.6% increase this quarter and a 3% increase over the past year. As the underutilization rate of labor increases and the number of employed people decreases, wage pressure is subsiding, which strengthens the trend of the labor market shifting towards looseness and highlights the need for further monetary policy support from the Reserve Bank of New Zealand.
The Reserve Bank of New Zealand is expected to significantly lower interest rates again
Overnight index swaps (reflecting market expectations for future cash rates in New Zealand) indicate a 92% chance that the Reserve Bank of New Zealand will cut interest rates by 50 basis points on February 19th. This will be the third consecutive significant interest rate cut, reducing cash rates by 175 basis points compared to before the start of the loose cycle.
In the past, the Reserve Bank of New Zealand had a reputation for "creating surprises," but this trend has recently weakened as the bank has lowered interest rates according to market pricing in the past two meetings.
NZD/USD: Emotionally driven game of the 'Chinese factor'
The driving force behind the trend of the New Zealand dollar/US dollar is not the interest rate outlook of New Zealand, but rather the risk appetite, especially towards the Chinese market, which is playing a greater role.
For example, the 20 day rolling correlation between the New Zealand dollar/US dollar and the US dollar/offshore Chinese yuan (USD/CNH) is -0.95, indicating a strong inverse relationship between the two. Although to varying degrees, the positive correlation between the New Zealand dollar and US stock index futures is relatively strong, especially with more cyclical indices such as the Russell 2000 and the S&P 500.
By contrast, at the beginning of 2025, the short-term and long-term yield spreads between the United States and New Zealand did not show a clear relationship.
NZD/USD has strong buying power on dips
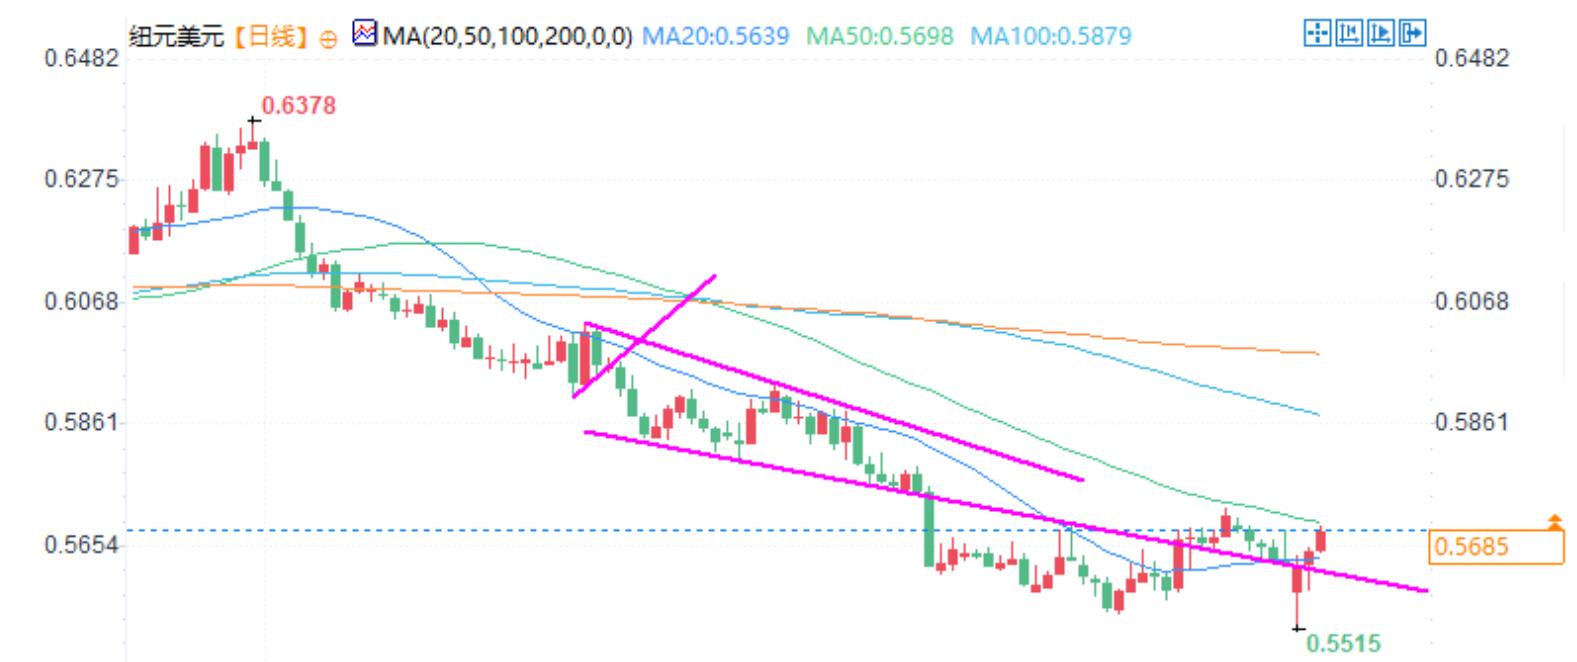
Despite the volatile market in recent weeks, the New Zealand dollar/US dollar remains within known technical levels - as shown in the daily chart - and the price continues to interact with the downward trend formed in mid November.
Indeed, the price has repeatedly broken through the trend line, but bearish breakthroughs have not been effectively maintained, and the price has rebounded above the trend line at the close. Combined with the bullish meteor line that appeared on Monday (a clear bottoming signal), the price trend suggests that a recent bottom may have formed around the low point of 0.5515 in October 2022. The bullish hammer line on Tuesday further strengthened this viewpoint.
The momentum indicator gives a mild bullish signal, the MACD indicator rises, and the relative strength index RSI (14) broke through a small downward trend earlier this week. Therefore, there is currently a slight inclination towards a bullish trend.
The upper resistance levels worth noting include 0.5700 near the 50 day moving average, 0.5720 from the January 24th high, and 0.5754. If it falls below and closes below the November 2024 downtrend line, it will eliminate the bullish trend. If it continues to fall below 0.5515, it will completely turn bearish.
Tips:This page came from Internet, which is not standing for FXCUE opinions of this website.
Statement:Contact us if the content violates the law or your rights