Gold prices continue to rise, reaching a new record high of 2670 at one point. Analysts say there is no sign of giving up on the upward trend
On Wednesday (September 25th), during the Asian market session, spot gold suddenly experienced a short-term upward trend, with the gold price just touching a record high of $2670.53 per ounce. Currently, it has slightly fallen back to around $2661.72 per ounce per week. Analyst Valeria Bednarik wrote an article analyzing the prospects of gold technology.
Bednarik pointed out that market participants have increased their bets on the Federal Reserve cutting interest rates by another 50 basis points. The unexpectedly negative performance of US economic data has damaged demand for the US dollar. The price of gold is trading at a new historical high and shows no signs of giving up on its upward trend.
Gold has continued its upward trend from the previous trading day. Due to the tension in the Middle East and the deterioration of US consumer confidence, gold has become more attractive as a safe haven. In addition, the yield of US treasury bond bonds has fallen and the US dollar has weakened, gold prices rose nearly 30 dollars on Tuesday.
The Conference Board reported on Tuesday that the US Consumer Confidence Index for September plummeted from 105.6 in August to 98.7, marking the largest monthly decline since August 2021. Previously, respondents to the Dow Jones survey generally predicted that the index would be 104.
Spot gold closed up $28.59, or 1.09%, at $2656.97 per ounce on Tuesday.
Israel has launched airstrikes on Hezbollah strongholds in southern Lebanon and has stated that it will continue to exert pressure. Bob Haberkorn, Senior Market Strategist at RJO Futures, stated that the current surge in gold prices is due to concerns about the situation in the Middle East and seeking safety.
Haberkorn believes that Iran may take the next step, so gold will continue to hit new highs. Due to increasing market concerns about a full-scale war in the Middle East, gold prices have risen by 28% so far in 2024.
The Federal Reserve's relaxation of monetary policy has also driven up gold prices, as gold does not yield interest and interest rate cuts can reduce the opportunity cost of holding gold.
Short term technical prospects for gold
Bednarik stated that there is no sign of the gold price giving up its upward trend. On the daily chart, gold prices continue to hit higher highs and lows, while technical indicators maintain a moderate bullish slope within overbought levels. At the same time, gold prices are much higher than the bullish moving average, with the 20 day simple moving average (SMA) currently hovering around $2545 per ounce.
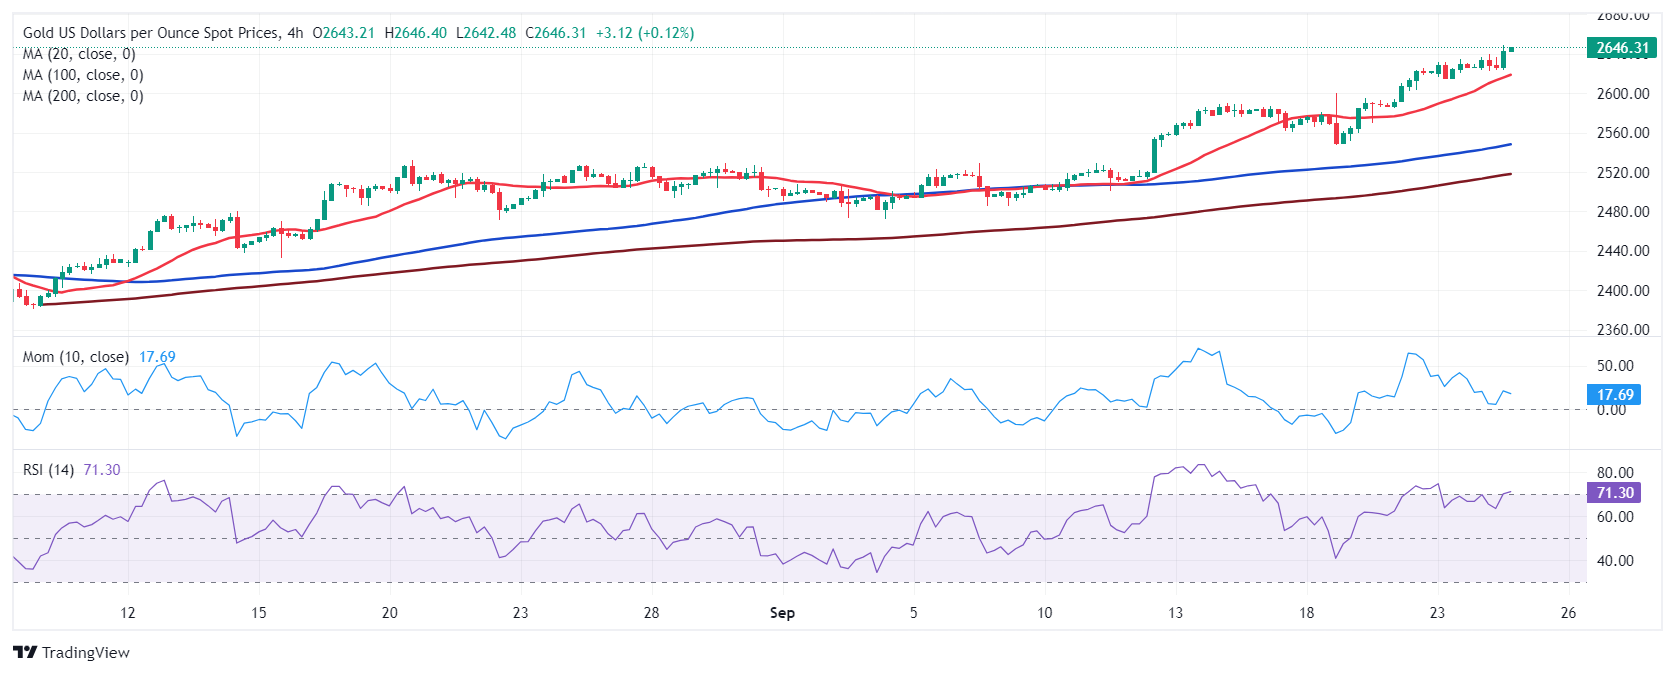
Bednarik added that the recent situation has also tilted the risk of gold prices towards an upward trend, although some divergence performances may suggest a corrective decline in gold prices. In the 4-hour chart, the moving average is accelerating upwards at a level far below the current gold price, which is consistent with sustained buying interest. However, the momentum indicator continues to decline in the positive region, deviating from the price trend. Finally, the Relative Strength Index (RSI) maintains a positive trend and is currently rising to levels close to overbought readings.

(4-hour chart of spot gold)
Bednarik provides the latest important support and resistance levels for gold prices:
Support level: $2628.10 per ounce; 2613.50 US dollars per ounce; 2598.10 USD/oz
Resistance level: $2675.00 per ounce; 2690.00 USD/oz
Tips:This page came from Internet, which is not standing for FXCUE opinions of this website.
Statement:Contact us if the content violates the law or your rights
