Can gold prices continue to rebound?
On Friday, June 28th, during the Asian market session, spot gold fluctuated and weakened, briefly falling below the 2320 level to $2318.94 per ounce. Currently, trading is around $2322.65 per ounce. Valeria Bednarik, Chief Analyst of FXTree, wrote an article analyzing the prospects of gold technology.
Click on the image to open and view it in a new window
Bednarik pointed out that gold prices currently lack bullish momentum. The focus now shifts to the Personal Consumption Expenditure (PCE) Price Index in the United States. This most favored inflation indicator by the Federal Reserve will be released on Friday, and it is expected that the PCE inflation rate in May will increase by 2.6% year-on-year, slightly lower than the previous 2.7%.
Bednarik stated that the easing of inflationary pressure should boost people's hope for an upcoming interest rate cut in the United States and lead to a decline in the US dollar. However, due to the possibility of the market becoming optimistic, the opportunity for gold to rebound is limited.
On Thursday (June 27th), weak economic data supported expectations that the Federal Reserve would start cutting interest rates this year, putting pressure on the US dollar, and spot gold surged nearly $30.
Spot gold closed up $29.26, or 1.27%, at $2327.30 per ounce on Thursday.
At 20:30 Beijing time on Friday, personal consumption expenditure (PCE) price data for May in the United States will be released, which may reveal the interest rate path of the Federal Reserve.
According to authoritative media surveys, the monthly rate of the US PCE price index in May is expected to remain unchanged, after an increase of 0.3% in April. The PCE price index in the United States is expected to grow at an annual rate of 2.6% in May, compared to a 2.7% increase in April.
In terms of more critical core data, the survey shows that the core PCE price index in the United States is expected to grow at a monthly rate of 0.1% in May, compared to an increase of 0.2% in April; The core PCE price index in the United States is expected to rise at an annual rate of 2.6% in May, compared to a previous 2.8% increase.
As the most favored inflation indicator by the Federal Reserve, the year-on-year changes in the core PCE price index have a significant impact on policymakers.
Analysis of Short term Technical Prospects for Gold
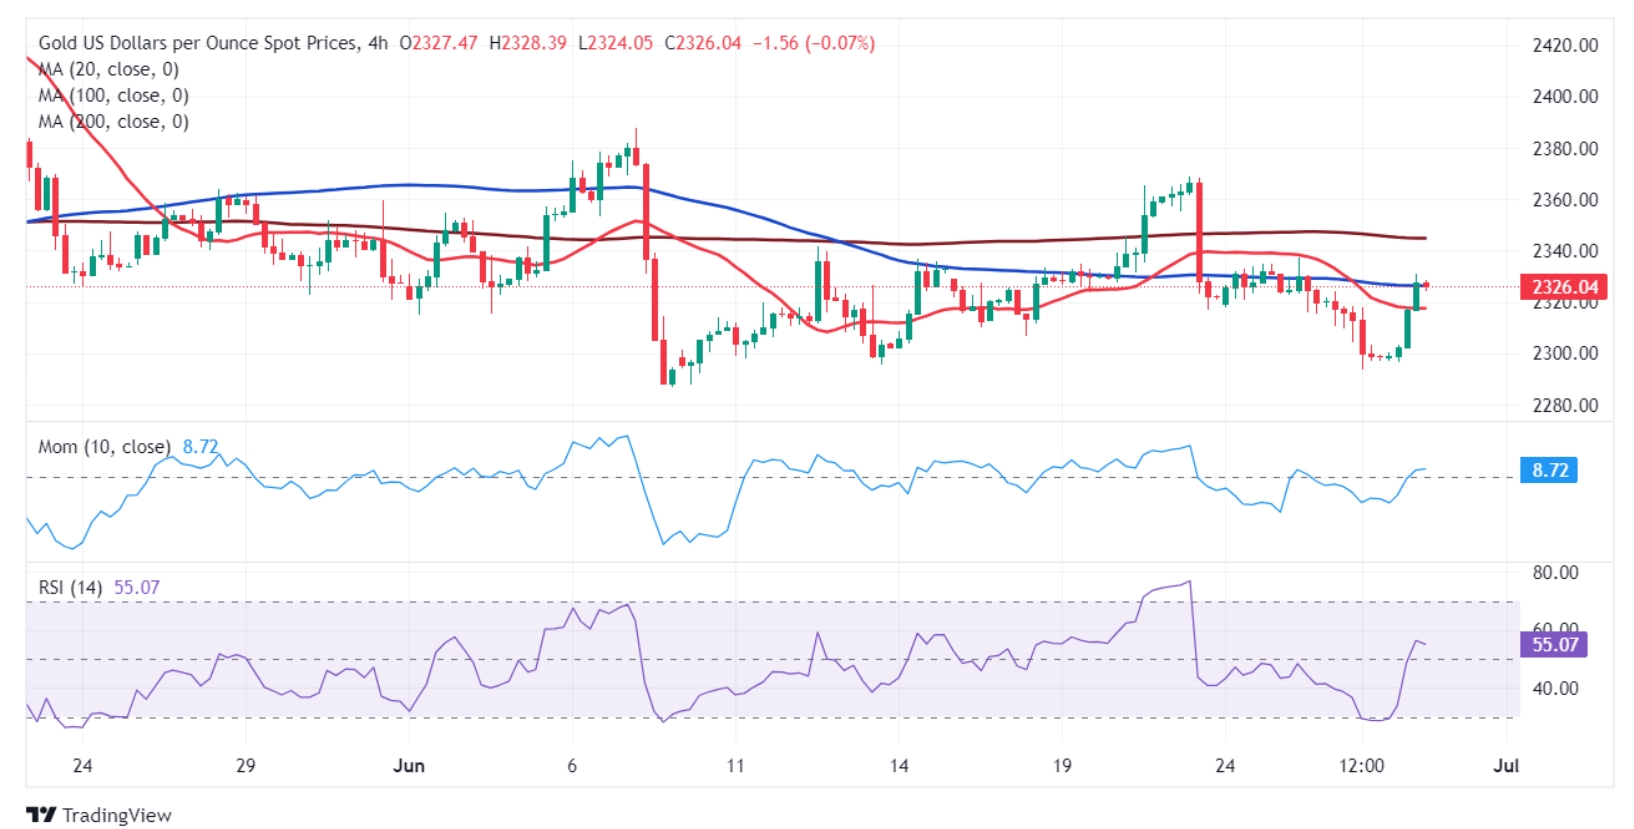
Bednarik stated that the daily chart shows limited bullish potential for gold. Gold prices have encountered sellers near the mildly bearish 20 day simple moving average (SMA), which is currently around $2327.60 per ounce. At the same time, technical indicators have increased but are still at a neutral level, and the Relative Strength Index (RSI) is striving to break through the level of 50. At the same time, the 100 day and 200 day moving averages maintain a bullish slope below the current gold price level, with the former providing dynamic support around $2252.40 per ounce.
Bednarik added that based on the 4-hour trend chart, the short-term outlook for gold is neutral. Technical indicators have rebounded from recent lows, but remained stable near the median, reflecting a decrease in buying interest. At the same time, the rebound trend of gold prices has stagnated near the flat 100 cycle SMA moving average.
Bednarik provides the latest important support and resistance levels for gold prices:
Support level: $2308.30 per ounce; 2293.50 USD/oz; 2279.60 USD/oz
Resistance level: 2327.60 USD/oz; 2337.00 USD/oz; 2345.20 USD/oz
At 10:29 Beijing time, spot gold was trading at $2322.27 per ounce.
Tips:This page came from Internet, which is not standing for FXCUE opinions of this website.
Statement:Contact us if the content violates the law or your rights