Gold has experienced a pullback, but the medium-term upward trend remains stable!
After hitting a new historical high earlier this week, gold continues to face strong selling pressure. However, Kelvin Wong, Senior Market Analyst at OANDA, stated that there is still a considerable distance to go before the upward trend of gold prices is threatened by geopolitical uncertainty.
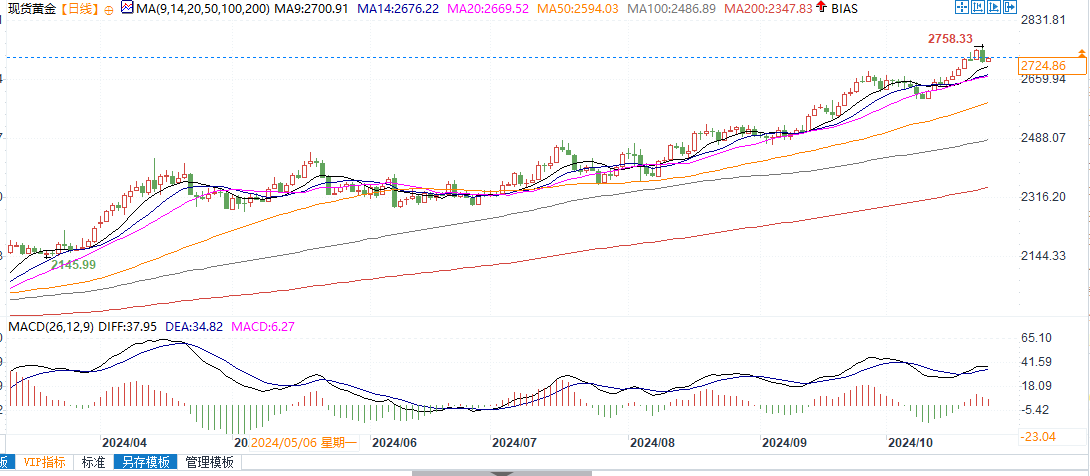
Kelvin Wong stated that the $2590 level is a key support for the mid-term of gold. If this support is not maintained, it negates the bullish tone of the multi week correction sequence that unfolded during the main uptrend stage, thereby exposing the next medium-term support levels of $2484 and $2360.
However, Wong expects that the gold price will not experience a significant correction soon, as the market has successfully attracted significant upward momentum.
He pointed out that the gold price has been stable above the 20 day moving average and 50 day moving average, and the momentum indicator is also showing an upward trend. These indicators indicate that the medium-term upward momentum of gold remains intact.
Wong stated that the next major resistance level for gold will be around $2850 per ounce.
Wong pointed out that in addition to the technical momentum of gold, gold continues to receive solid fundamental support as a safe haven asset. He explained that the recent record high in gold prices seems to be part of a new 'Trump trade', as Republican candidates and former President Trump have seen the market begin to digest expectations of his possible victory in the November election.
Meanwhile, Wong pointed out that the trend of gold prices is not just a response to the uncertainty of the US election. The increasing geopolitical uncertainty and concerns about economic slowdown due to sustained high inflation have made gold an attractive tail risk hedging tool.
He said, "The rising inflationary pressure and geopolitical risk premium are a deadly mixture that could lead to stagflation and trigger potential safe haven events in global financial markets. From a technical analysis perspective, the ratio chart of the S&P 500 index relative to gold and the monthly RSI momentum indicator of the S&P 500 index/gold ratio show that the S&P 500 index has performed significantly poorly relative to gold since February 2024. Therefore, the recent increase in demand for portfolio tail risk hedging activities may also strengthen the trend of gold

Daily chart of spot gold
Tips:This page came from Internet, which is not standing for FXCUE opinions of this website.
Statement:Contact us if the content violates the law or your rights
