Gold is approaching the bearish interest point, where is the "golden pit buying point" this week?
Last week (week 1021-1025), gold prices hit a new historical high of 2758, closing up 0.89% to $2746.26 per ounce. The hourly chart shows that the entire week has unfolded according to this rhythm: opening at 2720- rising to $2740- falling sharply to $2714- rising to $2758- falling sharply to $2708- rebounding to $2740- retraceing to $2720- continuing to rebound to $2746. Compared to the smooth rise of the previous week, the gold price of 1021-1025 this week tends to rise in a volatile pattern. This will have a significant impact on the gold price trend for the next week.
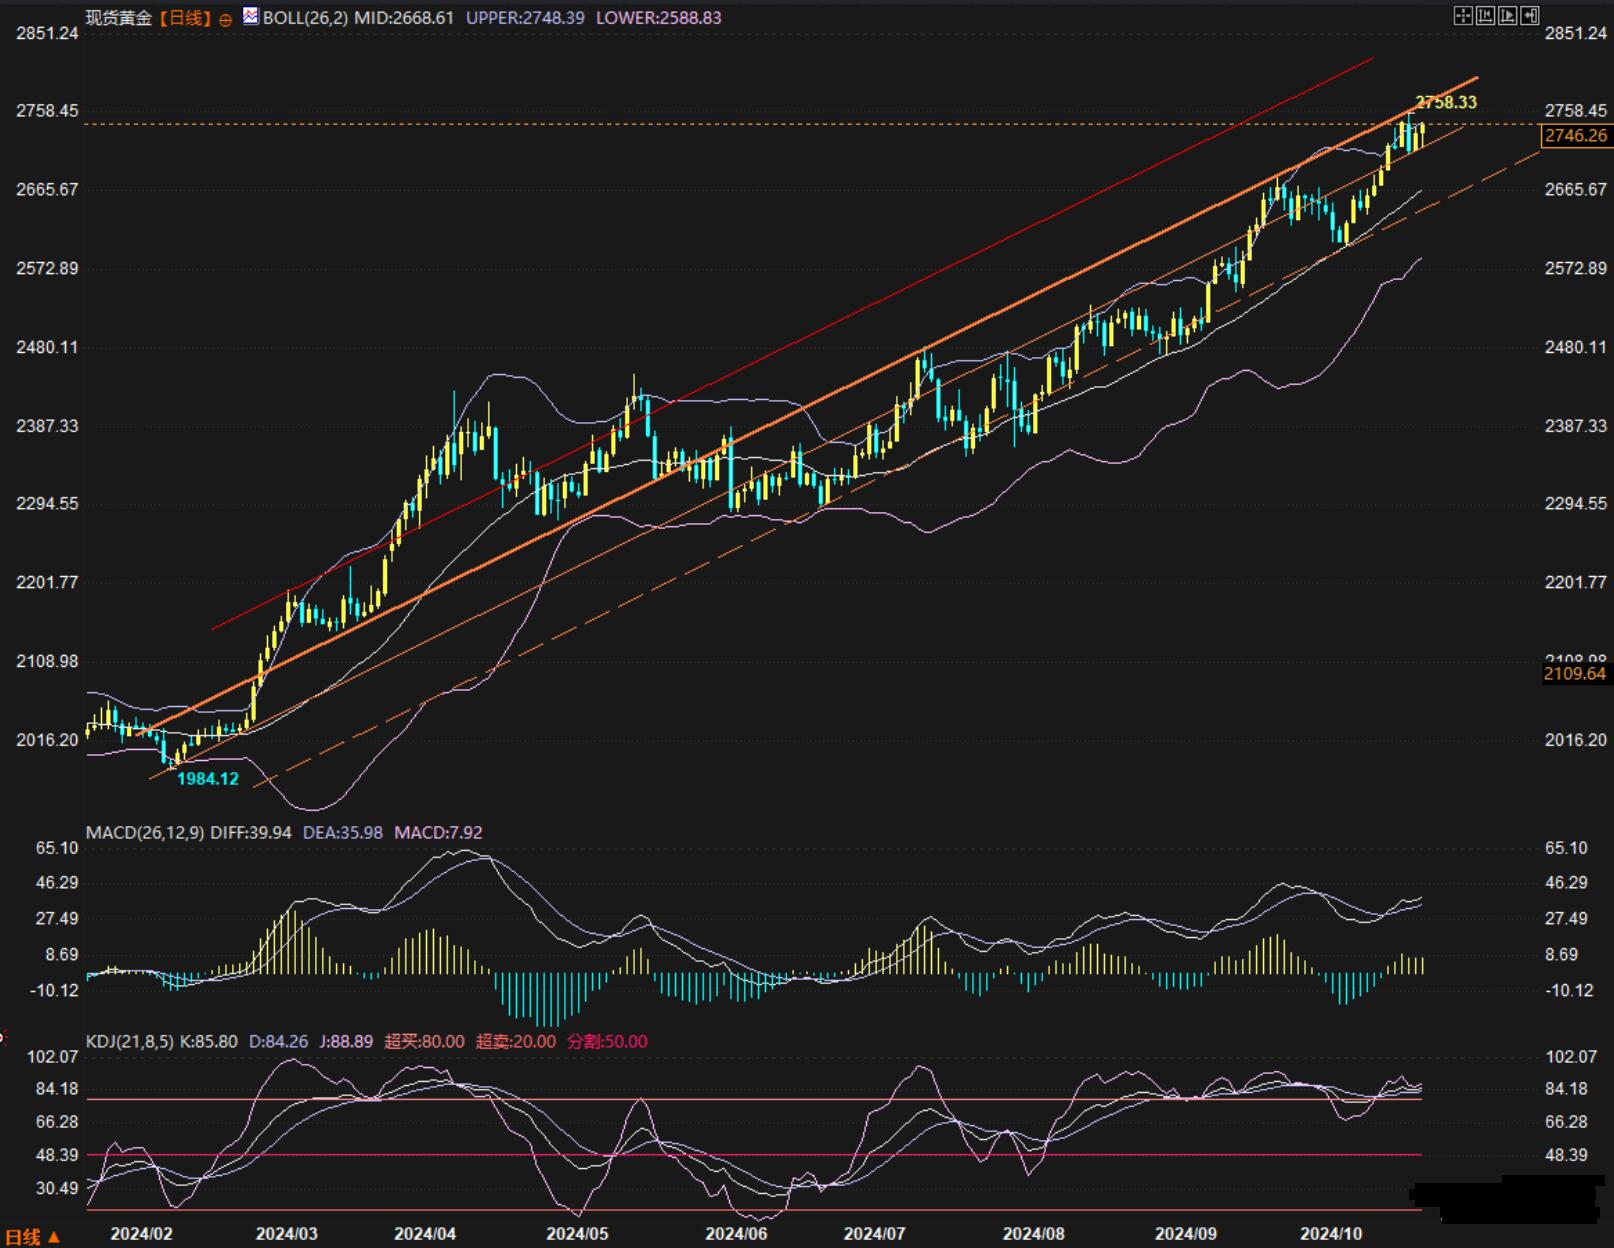
Looking back, several key points in my article that went online before the opening on Monday, 1021, were in line with the prediction at that time: 2715 support, 2722 support, 2740 resistance, 2750 resistance, 2758 resistance, daily level orange bold diagonal resistance, and a parallel orange solid line support, all of which played significant and important roles in the actual market. And at that time, I predicted that the rise in gold prices would not exceed 2766 and the fall would not fall below 2700. Therefore, I stated that "exceeding 2700 or 2766 is a very unlikely situation in my opinion, and I will not analyze it." This prediction is not significantly different from the actual market range of 2708-2758 and is relatively symmetrical.
According to the latest market trend, gold prices have shown signs of divergence from MACD and KDJ overbought at 15 minute and below levels. The 30 minute chart, 60 minute chart (1H chart), 2H chart, and 4H chart represent the range oscillation market, with the key upper and lower limits of the range being 2750-2717 and 2758-2708, respectively. The daily chart shows that the price has been effectively supported by the orange solid line of the daily chart for three consecutive days after a sharp drop of $50 from 2758. Therefore, the gold price has been at the bullish line for two consecutive days. Due to the closing price of 2746 near 2750 resistance on Friday, 1025, and the short-term overbought divergence state, if the gold price rises after opening this week (week 1028-1101), it is easy to be suppressed by selling. This week, we will continue to monitor the support or resistance effects of these three orange trend lines and one red trend line on the market.

(Daily chart: Technical analysis of spot gold daily chart)
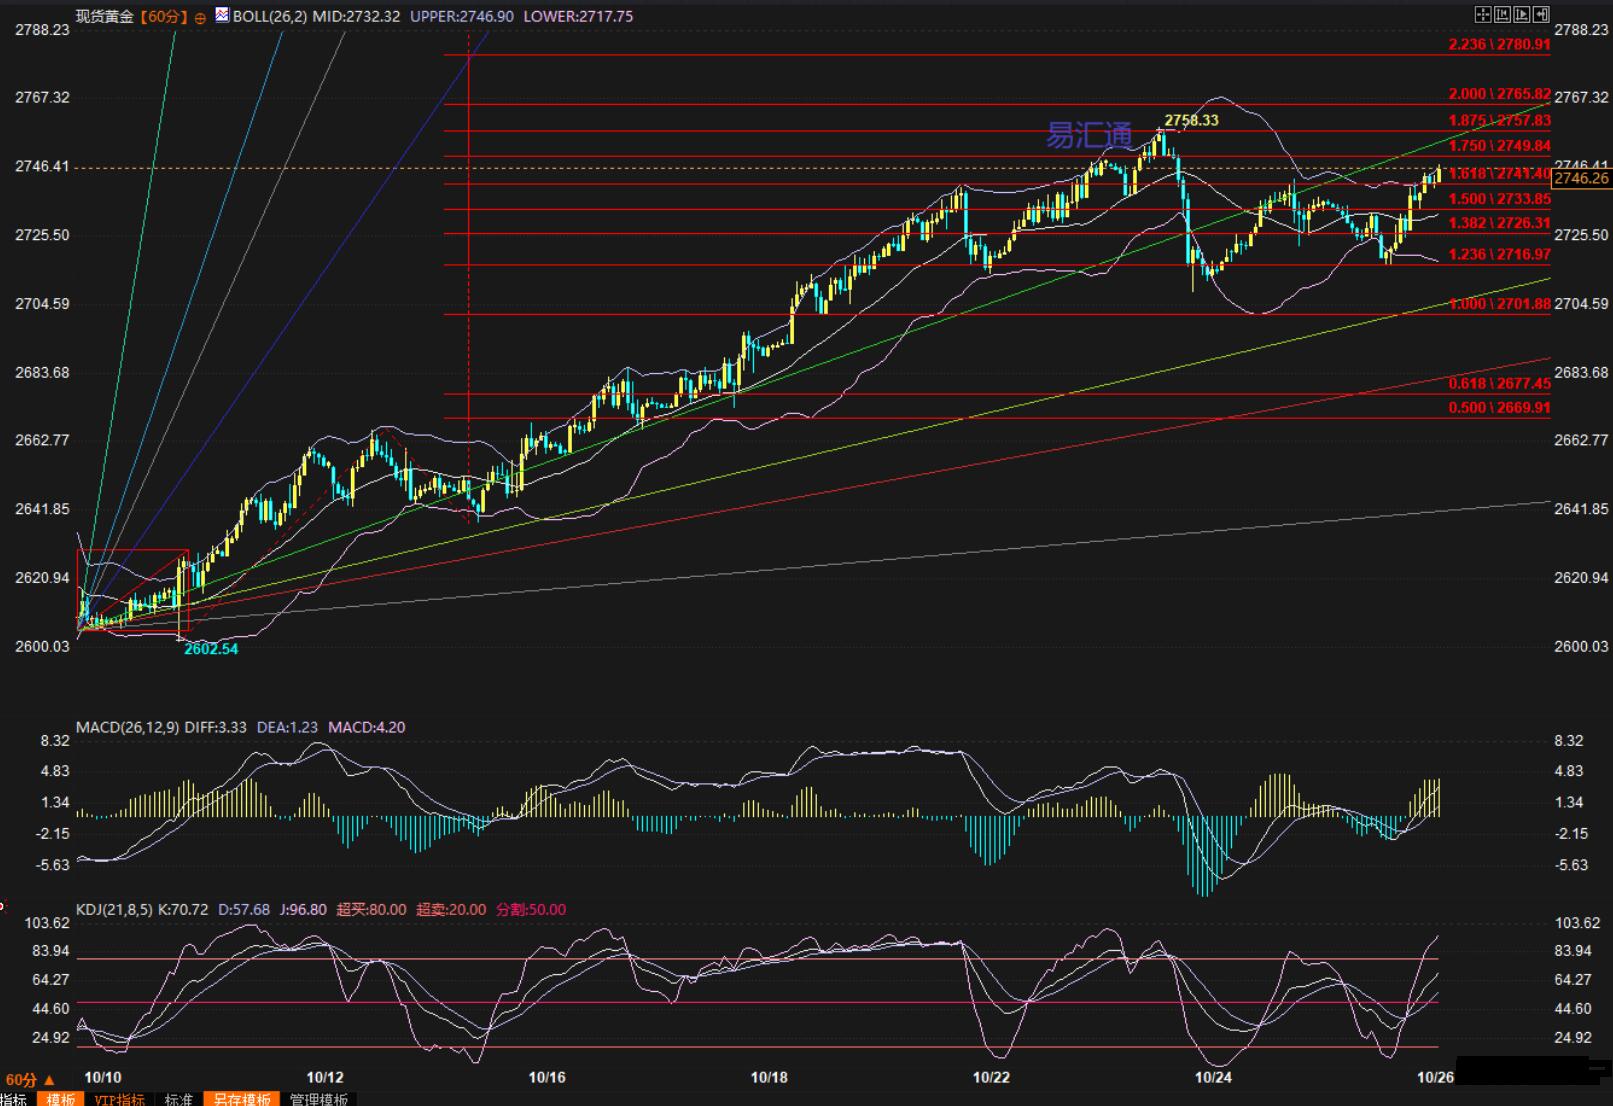
Based on the technical analysis of the 1H chart, the gold price was clearly supported and closed at 2746 after hitting 2742 before the close on Friday, 1025. The upper resistance was first at 2750, which is not only an important psychological barrier but also the 175% extension level (1.75 extension level) as shown in the chart. Above it, 2758 is not only the historical high reached last week, but also the 187.5% extension level. Above 2766 is the 200% extension level, which we mentioned in our article before last week's opening. The first two price levels also played a significant role in last week's actual market situation. This week, we will continue to pay attention to their suppression of the market (of course, if they break through, they will become support).

(1H chart: Technical analysis of spot gold 1H chart)
In terms of support, focus on 2742-2740, 2734-2732, 2722-2720, 2717 in sequence, followed by 2712-2708. If it falls below last week's low of 2708, then pay attention to the range of 2700-2696, followed by the high of 2685.5 on September 26th (≈ 2685).
According to trend theory, the retracement of gold prices cannot fall below 2685, otherwise it will mean that the upward trend will be disrupted. Of course, if the short term happens to be boosted by negative news, it is an exception if it breaks through during trading but does not close.
Therefore, overall, the rise of gold prices towards bearish interest points 2750 and 2758 is susceptible to selling pressure. As the sharp decline initiated by 2758 has not yet entered its second round, there is a risk that the price will reverse and rebound in the 2750-2758 range, and restart the decline. The key support is the low point of 2708 last week. If this price level is clearly supported by buying after testing, it is expected to end the oscillation in a double bottom mode and refresh the high again. If it falls below 2708, there is a possibility of a pre dip high of 2685 support. Due to the fact that the daily chart and above of gold are still in an upward trend, if there is a dip in these two price levels, there is hope that they will become "golden pit" buying points (ideal long positions). According to the general trading pattern, it is only necessary to set a stop loss near the price below it. As long as the stop loss is not broken, the profit loss ratio is large.
If the gold price breaks through 2758 before falling sharply again, focus on the downside risk after 2766. If there is a significant drop this week and it breaks through 2758, then focus on 2766 and 2781.9 (i.e. 2.236 expansion level) in sequence, and look up to the 2797.8 and 2800 levels. It is expected that the probability of exceeding 2782 this week is relatively small.
Tips:This page came from Internet, which is not standing for FXCUE opinions of this website.
Statement:Contact us if the content violates the law or your rights
