US Q3 GDP data hits, analysts: technical indicators support another wave of gold price rise
On Wednesday (October 30th), spot gold maintained its intraday upward trend in the Asian market, with gold prices currently standing at $2780 per ounce. Analyst Valeria Bednarik wrote an article analyzing the prospects of gold technology.
Bednarik wrote that the reasons for bullish on gold remain solid, and buyers are now aiming to test at $2800 per ounce.
Gold continues its upward trend from the previous trading day. Due to the uncertainty of the US presidential election and the Middle East conflict, as well as expectations of interest rate cuts by the Federal Reserve, the investment attractiveness of gold has been enhanced, and spot gold surged over $32 on Tuesday.
Spot gold closed up $32.30, or 1.2%, at $2774.35 per ounce on Tuesday. During the trading session in Sanya, the gold price briefly hit a record high of $2782.17 per ounce.
Han Tan, Chief Market Analyst at Exinity Group, said, "As long as the risks of the US presidential election continue to affect market sentiment and expectations of a Fed rate cut remain unchanged, gold prices should maintain an upward trend and may even touch $2800 per ounce in the coming days
The Bureau of Economic Analysis will release the third quarter Gross Domestic Product (GDP) data on Wednesday, which is the most important economic data of the day and is expected to trigger significant market trends.
Current market expectations indicate that the initial annualized quarterly rate of real GDP in the United States for the third quarter is expected to increase by 3%.
Analyst Eren Sengezer pointed out that if GDP data is higher than market expectations, the direct reaction may be to boost the US dollar and lead to a decline in gold prices. On the other hand, disappointing GDP data (between 1% and 2%) may harm the US dollar.
The GDP Now model of the Atlanta Fed shows that the US economy grew by 3.3% in the third quarter of 2024.
Short term technical prospects for gold
Bednarik wrote that the daily gold chart shows that technical indicators support another wave of upward trend in gold prices. On the 20th, the Simple Moving Average (SMA) accelerated its upward trend and is currently around $2685.00 per ounce, still far below the current gold price level. At the same time, the longer-term moving average has also gained bullish traction, being more than $300 lower than the current gold price level.
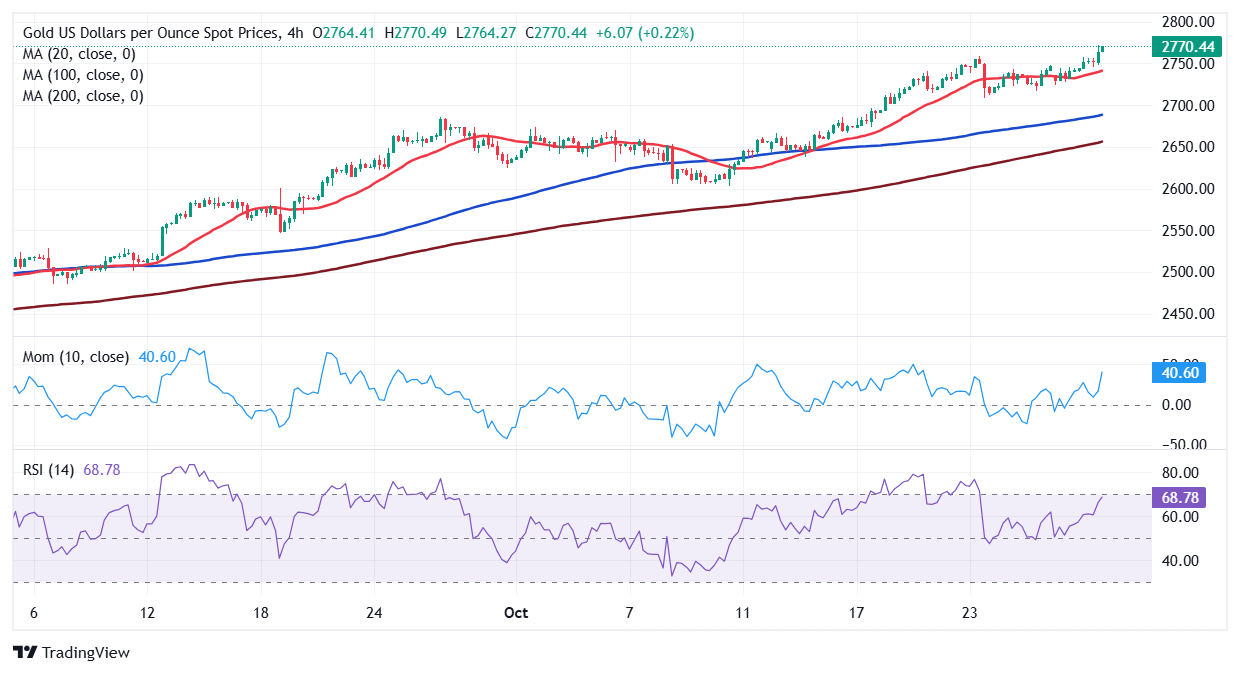
Bednarik added that in the 4-hour chart, technical indicators also support the continued bullish trend of gold prices. The indicator is steadily rising within the positive range, approaching overbought, but there is still room for improvement. In addition, the 20 cycle SMA has turned upward below the current gold price level, providing dynamic support around $2740.60 per ounce. At the same time, the 100 cycle SMA and 200 cycle SMA maintain a firm bullish slope at levels far below the short-term moving average mentioned above.

(4-hour chart of spot gold)
Valeria Bednarik provides the latest important support and resistance levels for gold prices:
Support level: 2751.90 US dollars per ounce; 2739.70 US dollars per ounce; 2721.20 USD/oz
Resistance level: $2790.00 per ounce; 2810.00 USD/oz
Tips:This page came from Internet, which is not standing for FXCUE opinions of this website.
Statement:Contact us if the content violates the law or your rights
