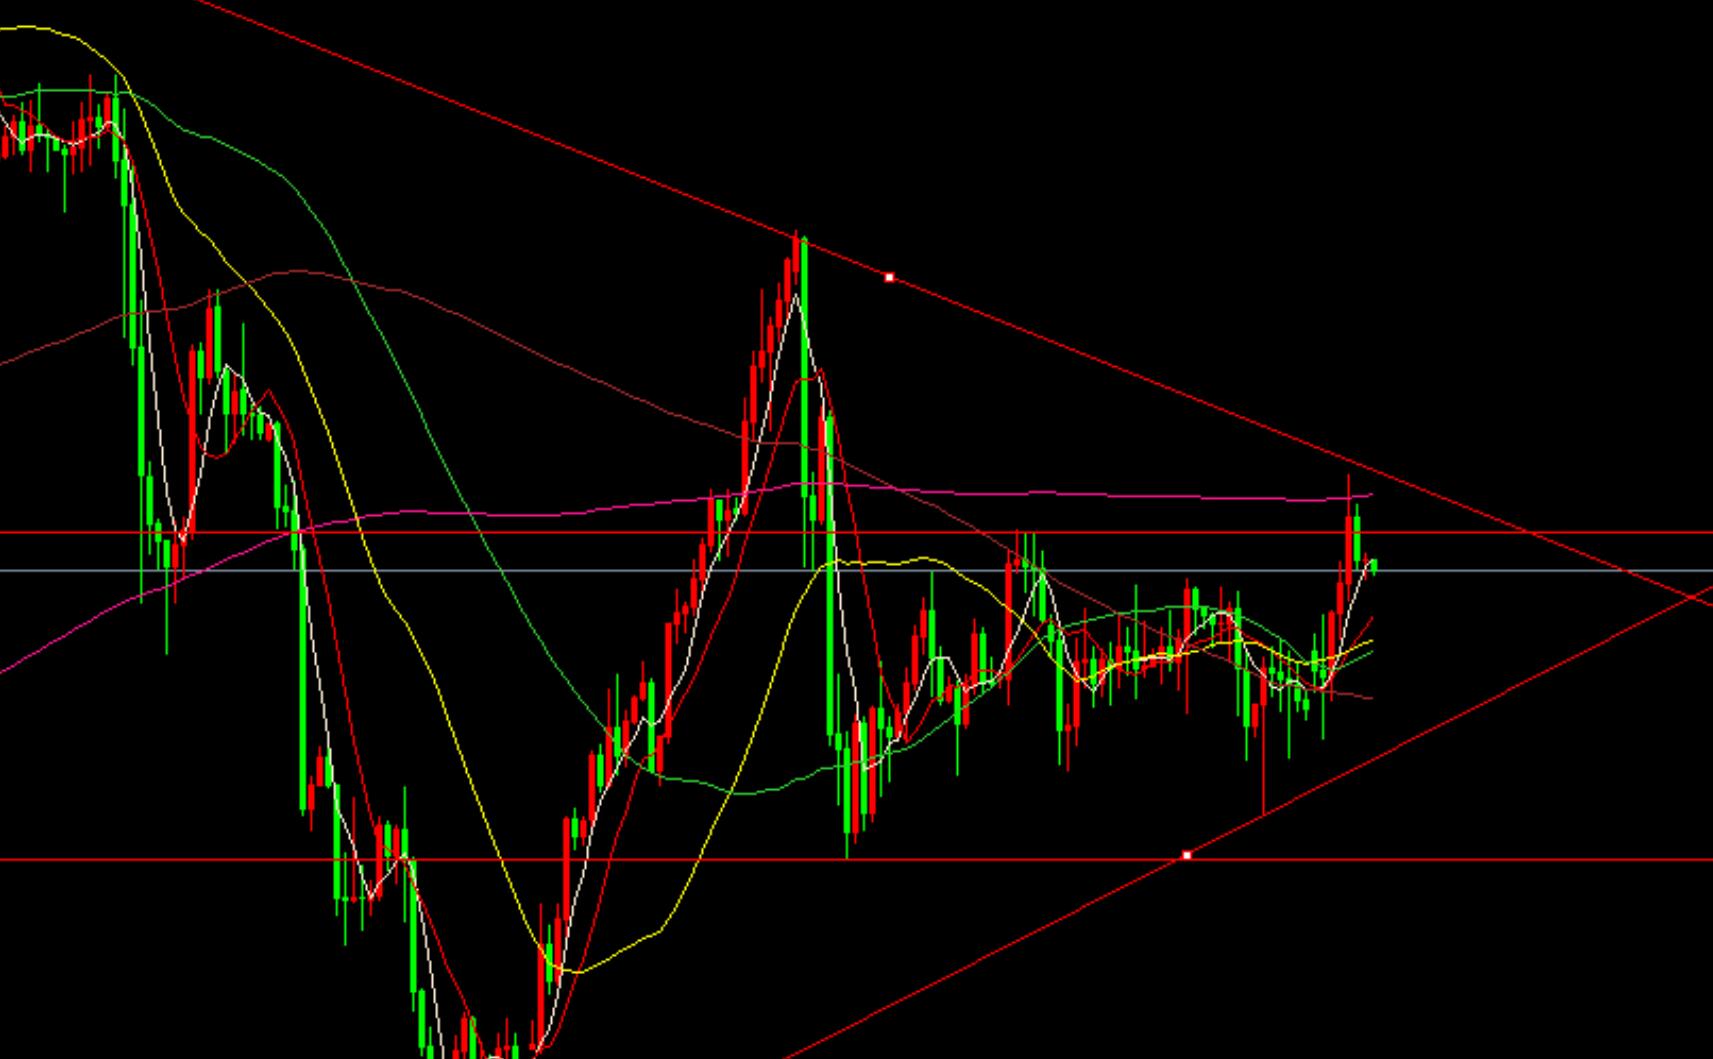
Spot gold triangle range fluctuates, with high short selling and low buying being the main focus
The gold daily chart rebounded with a small bullish candlestick, but the physical value remained small. After breaking through the upper limit of the range at 2665, it recovered within the range at the end of the trading session, and the range did not form an effective breakthrough. The physical candlestick of the daily chart is still organized as a star candlestick, waiting for the physical candlestick to increase volume and form a breakthrough.

The box interval of the 4-hour gold chart has expanded to the triangular contraction interval. Yesterday, it rebounded at the upper track of the triangular interval at 2677 and fell back under pressure, closing below the box interval of 2665. The 4-hour chart is in a passive oscillation, and the space and interval are still converging. With the contraction of time and space, the probability of breaking the position increases. Currently, it is still oscillating in the triangular interval, and there is still a certain distance from the upper and lower orbits. Before breaking, the oscillation train of thought remains unchanged. Short term short selling near the upper limit of 2666-2670 in the Asian market, with a defensive target of 2677. Return to the upper limit of 2645 and break to the lower limit. The interval has not broken, and the oscillation remains unchanged. Pay attention to the oscillation of the broken interval after effectively breaking through the triangular interval, and then follow up.
Disclaimer: The above views are for reference only. Investment carries risks, and caution should be exercised when entering the market
Tips:This page came from Internet, which is not standing for FXCUE opinions of this website.
Statement:Contact us if the content violates the law or your rights
