Gold price rises but encounters obstacles, Federal Reserve decides to face key game of ups and downs this week
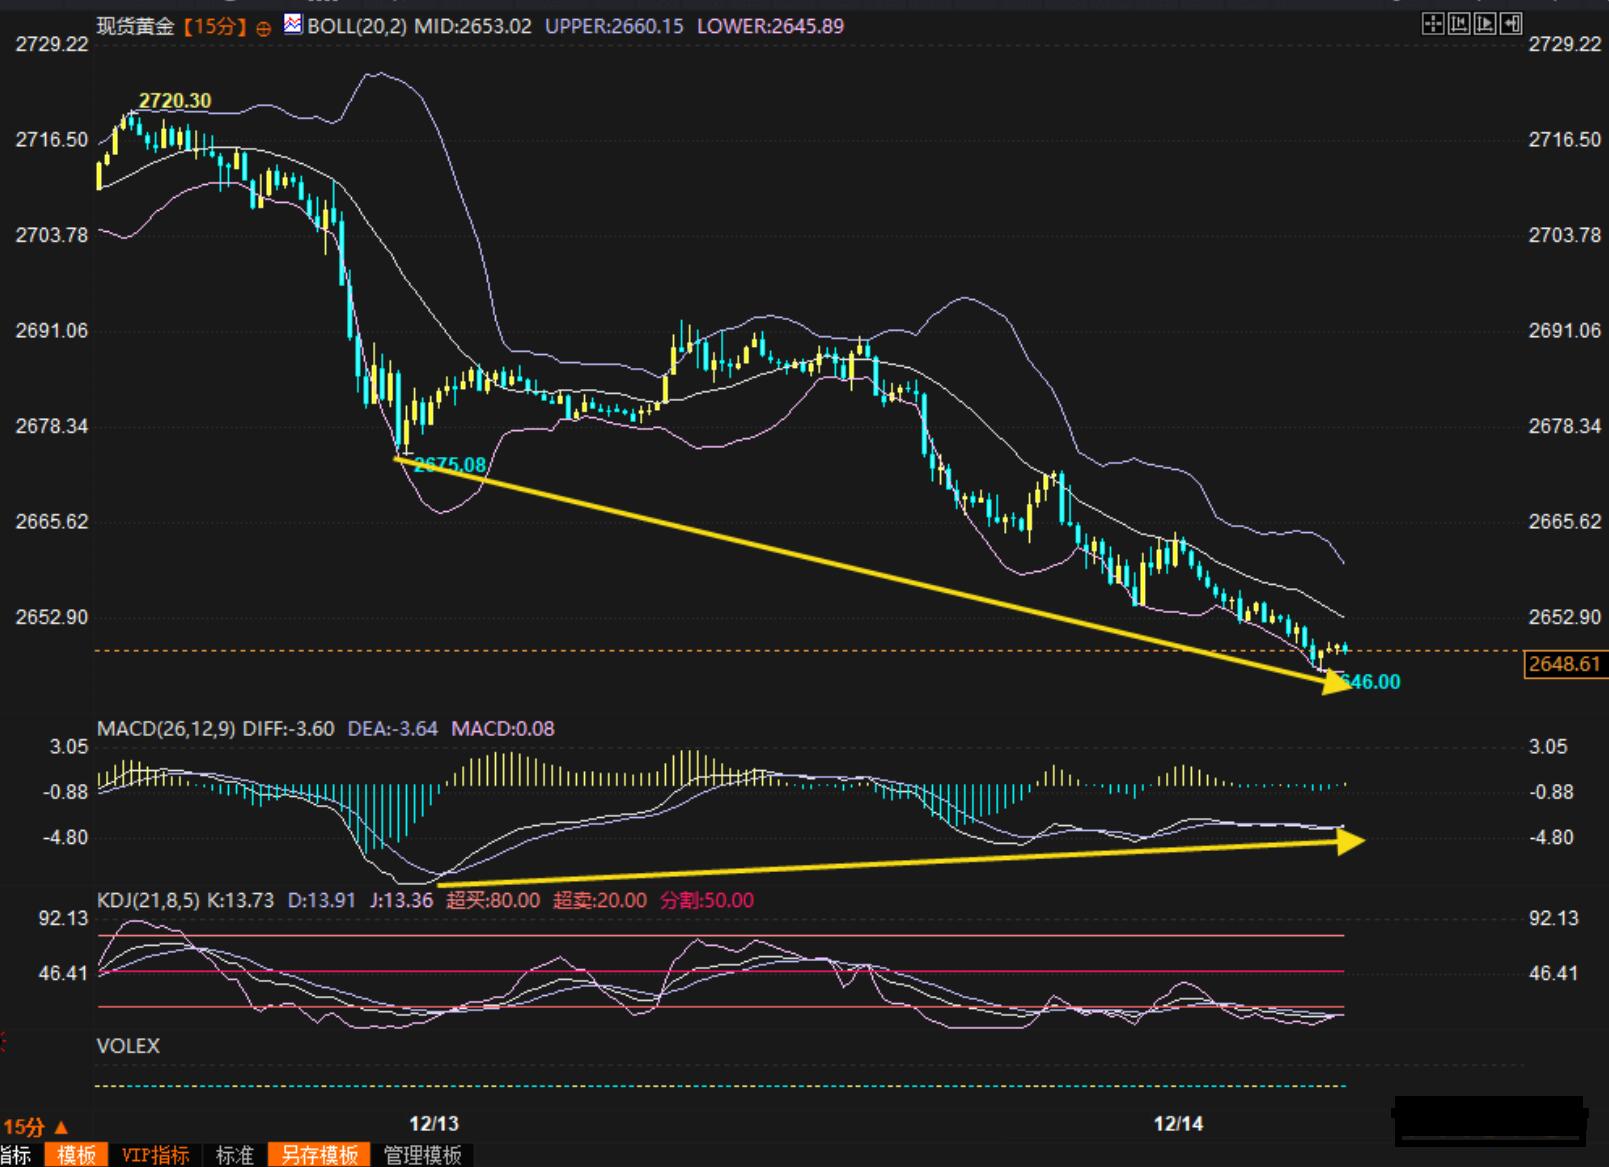
Last week (week 1209-1213), gold prices experienced another roller coaster ride of ups and downs, closing up 0.59% at $2648.61 per ounce, with a high of 2726 and a low of 2627.5. Although the weekly chart closed positive, it ended in the "Shooting Star" pattern, which is considered a reversal of bearish trend at high levels. However, it was not unexpected for the gold price to rise and fall during the oscillation process. This week (1216-1220) is Federal Reserve Resolution Week, and the market will face a crucial long short game.
Looking back, before the opening of last Monday (1209), the three aspects reminded by my gold price analysis chart were confirmed by the market: first, the reminder of whether the gold price has become more sensitive to positive news, resulting in a positive response from the gold price to the favorable geopolitical situation at the beginning of the week; second, the reminder to focus on the breakthrough of the triangular consolidation pattern, resulting in the market breaking on Tuesday. The third is to remind that if the gold price rises due to the expectation of the Federal Reserve's interest rate cut pushed up by US data, it is easy to be suppressed by selling after the gold price surges. The actual market situation is that after the US CPI pushes up the expectation of the Federal Reserve's interest rate cut and pushes up the gold price, the gold price will turn into a significant decline in the next two days.
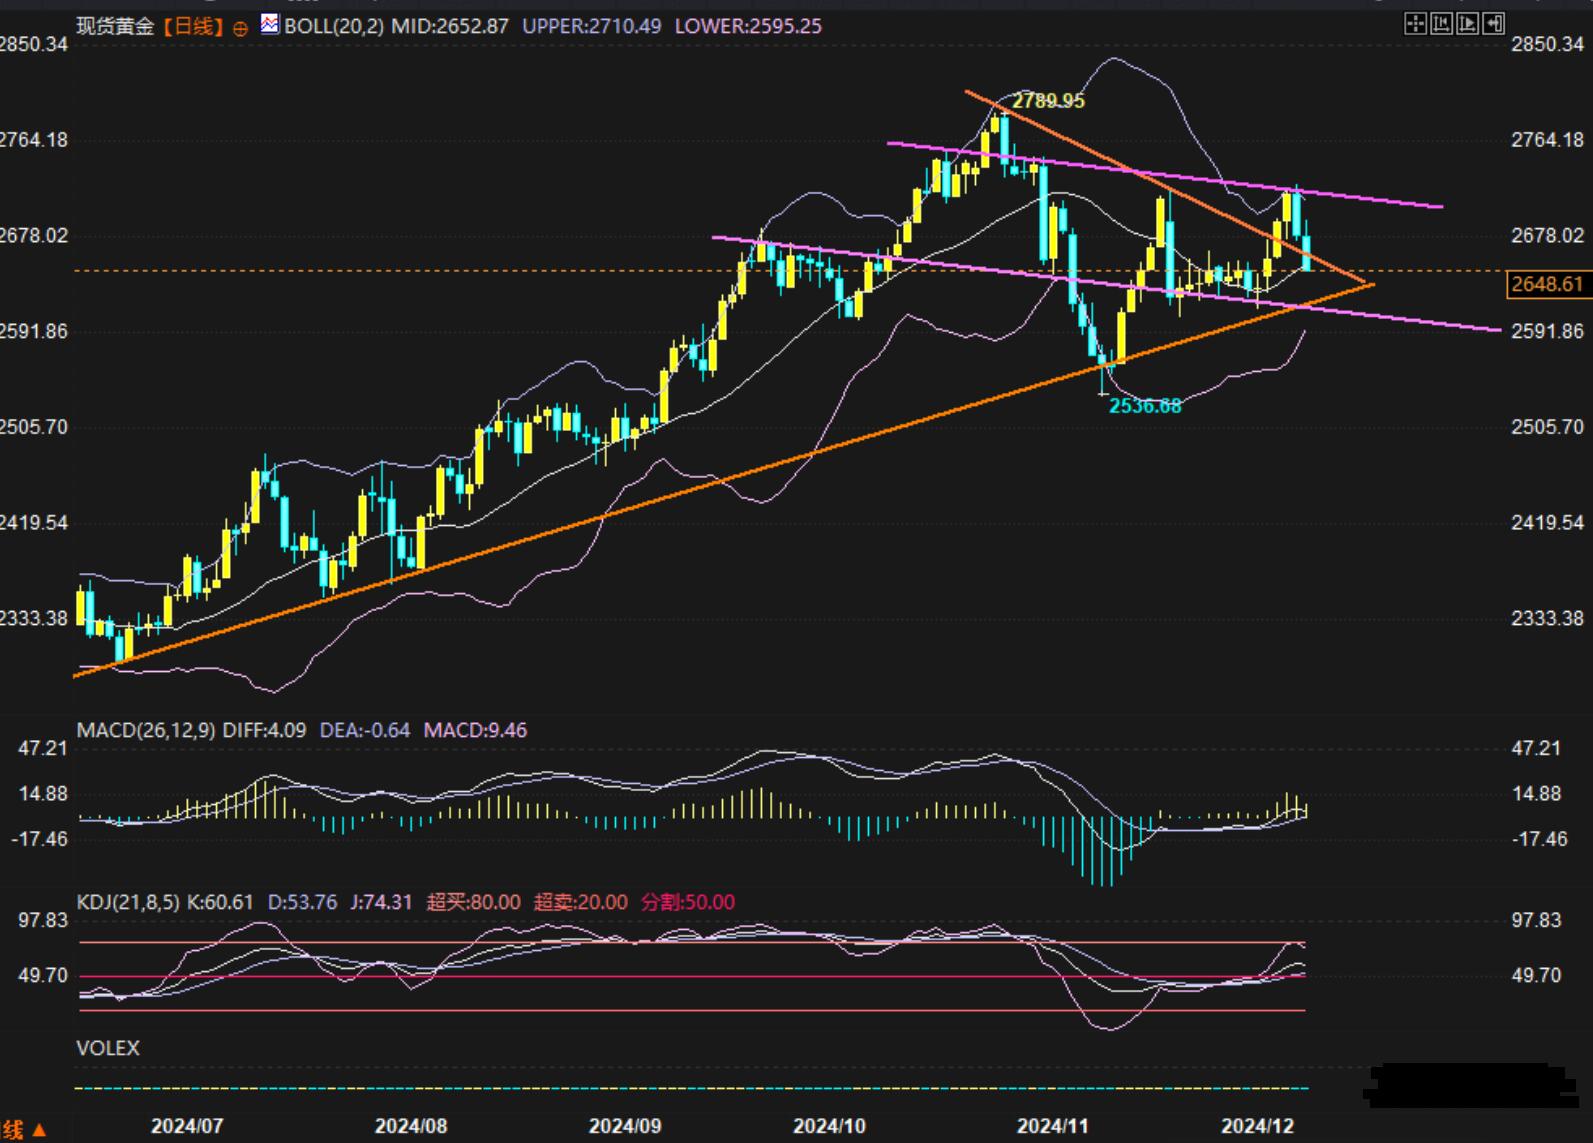
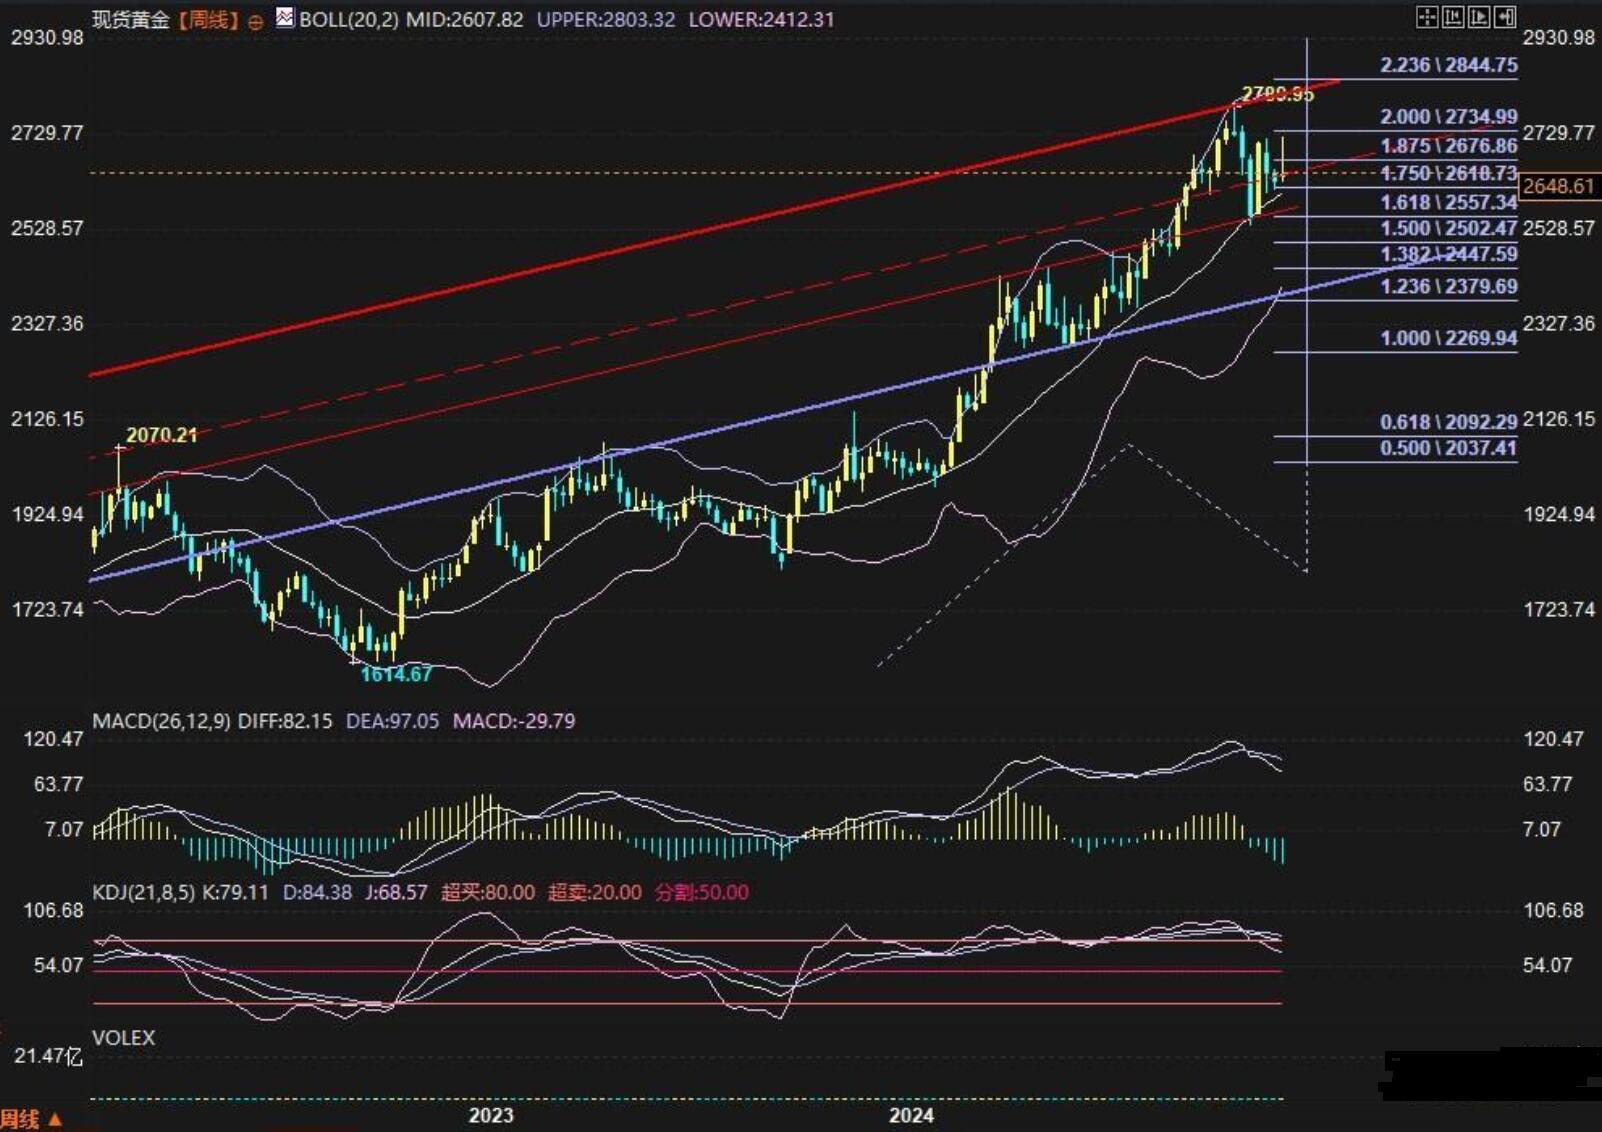
From the daily chart, why did the gold price drop from its high of 2726 last week? There happen to be several major resistance gathers here, one is the upper band of the daily chart Bollinger Bands (20,2), the second is the left and right shoulder trend lines of small head and shoulder tops near historical highs, and the third is the 2.00 extension level of this high point close to this trend market (1614-2079-1810) (this weekly line is more convenient for viewing). After the last two major bearish candlesticks, the gold price closed at 2648.6 near the middle of the daily Bollinger Bands at 2652.87. Next, we will focus on the backtesting situation of the mid track. It is expected that this backtesting will be unanimously attacked by bears before further decline. This Sunday's chart not only focuses on the thick orange triangle line from last week, but also needs to pay attention to the testing situation of the pink downward channel. It is expected that the market may test its support.

On a weekly basis, the red channel trend line that has been consistently placed in our chart recently, and last week's gold price closed at the red dashed line entry point, indicate that this line is playing an important role. As mentioned above, it is not a coincidence that last week's high also stopped near the 2.00 expansion level. The key focus of this week is whether the price will test the middle band of the weekly Bollinger Bands. If it is tested for the first time, it is estimated that it may trigger short-term buying, but whether it can support the bullish and bearish forces during testing and the coordination effect of news. If established firmly, it will be a major pillar of confidence for bulls. If it breaks down and receives confirmation of subsequent rebound pressure, it may trigger the bears' ambition to explore new lows.


Tips:This page came from Internet, which is not standing for FXCUE opinions of this website.
Statement:Contact us if the content violates the law or your rights
