Profit taking+US bond yields rise, gold prices fall nearly $40 from high levels
During the New York trading session on Wednesday (July 24th) to the beginning of the Asian market on Thursday (July 25th), spot gold experienced a sharp drop of nearly $40, and the current gold price has fallen below $2400 per ounce.
Due to the weakening of the US dollar and the fully priced Federal Reserve's September interest rate cut, spot gold briefly broke through the $2430/ounce mark on Wednesday. However, due to factors such as traders taking profits and rising US bond yields, all gains were sold back, ultimately closing down 0.51% at $2396.86/ounce.
Gold price hits nearly $40, plummeting sharply
Spot gold surged to $2432.03 per ounce at the beginning of Wednesday's New York session, setting a intraday high; But then the gold price fell sharply.
At the beginning of Thursday's Asian market session, spot gold further fell to $2392.95 per ounce, having fallen nearly $40 from its overnight high.
FXStreet analyst Christian Borjon Valencia pointed out that gold prices briefly hit $2432 per ounce during trading on Wednesday, and the "Federal Reserve Watch Tool" predicted a 100% chance of a 25 basis point rate cut in September, which boosted gold prices.
Valencia added, but the gold price subsequently gave up its gains and plummeted below $2400 per ounce. The yield of US 10-year treasury bond bonds rose by two basis points to 4.274%, which is a negative factor for gold.
Gold traders are currently waiting for the release of the US Q2 GDP data on Thursday, as well as the latest Personal Consumption Expenditures (PCE) price index to be released on Friday, as it is the Federal Reserve's preferred inflation indicator.
How to trade after a deep correction in gold prices?
Valencia reported that gold prices briefly hit a three-day high above $2430 per ounce on Wednesday, but have since fallen below the July 23 high of $2412 per ounce, indicating a lack of strength among buyers. A daily closing price lower than the latter may put further selling pressure on gold. However, US data will drive the gold price trend on Thursday and Friday.
The Relative Strength Index (RSI) is still bullish, but the slope has flattened, indicating a lack of direction for buyers and sellers.
Valencia pointed out that on the downside, if gold prices plummet below the July 22 low of $2384 per ounce, there may be a deeper correction. The next support level for gold prices will be the 50 day simple moving average (SMA) of $2359 per ounce.
Once gold sellers effectively push the price below the 100 day moving average of $2315 per ounce, the price is expected to further decline towards $2300 per ounce.
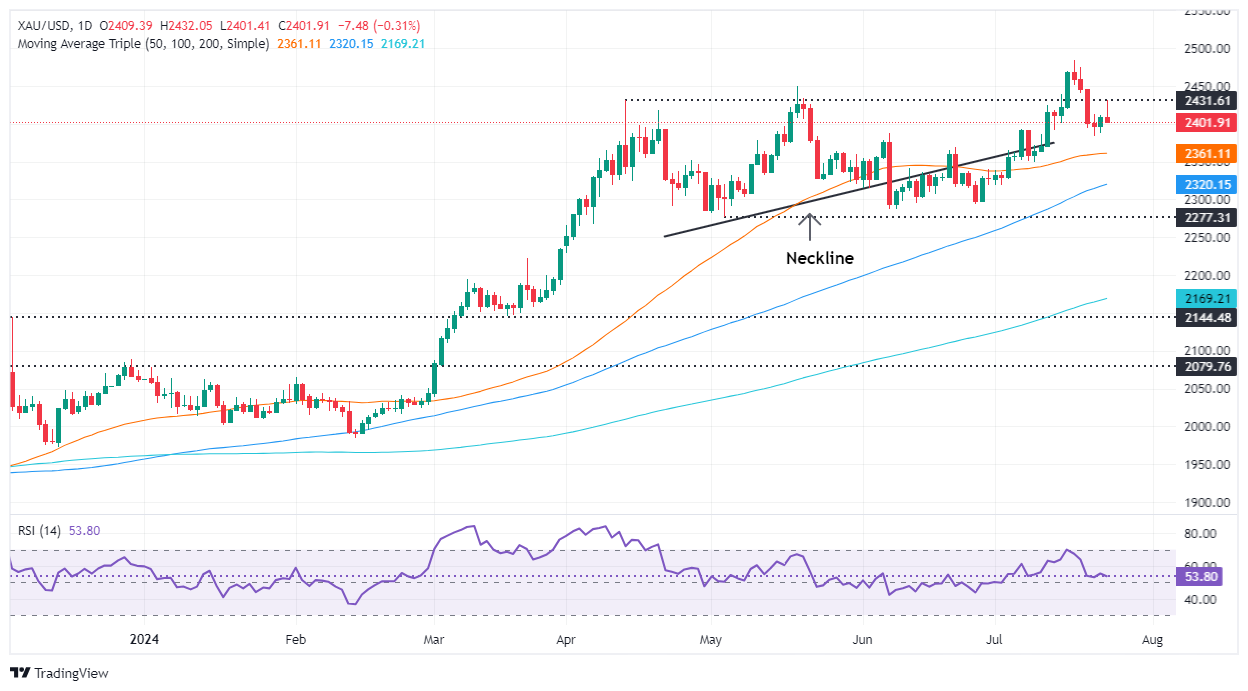
Daily chart of spot gold
On the upside side, Valencia added that in order to continue bullish, gold prices need to break through Wednesday's high of $2430 per ounce. Once it breaks through this level, the next resistance level for gold prices will be $2450 per ounce, and then challenge the historical high of $2483 per ounce. Finally, the gold price will target the $2500/ounce mark.
Tips:This page came from Internet, which is not standing for FXCUE opinions of this website.
Statement:Contact us if the content violates the law or your rights