Forex trading analysis: USD/CAD enters a downward triangle pattern
On Monday (February 24th) during the European trading session, the USD/CAD rebounded to around 1.4210, after previously falling to 1.4180. This rebound is closely related to the recovery of the US dollar, which has almost recovered from its previous decline, and the US dollar index (DXY) has also rebounded to around 106.60.
Despite weak US service sector data, the February S&P Global Services PMI data showed an unexpected contraction in service sector activity, marking the first contraction in 25 months, but the US dollar still rebounded. This data did not weaken the rebound of the US dollar, but instead pushed the US dollar index higher as market digestion may affect the Federal Reserve's monetary policy expectations.
On the other hand, the market remains concerned that US President Trump may impose a 25% tariff on Canada, despite delaying the tax plan for a month. On February 4th, Trump announced a one month delay in implementing 25% tariffs on Canada and Mexico. However, the Canadian side remains vigilant about potential tariff threats, with Bank of Canada Governor Tiff Macklem stating in a speech that if Trump imposes tariffs on Canadian imports, the economy will suffer a severe blow.
In terms of monetary policy, the market is paying attention to the movements of the Federal Reserve and the Bank of Canada. Although the US service industry is weak, the volatility of the US dollar remains high due to market concerns about Trump's tariff policies. The market will continue to monitor future data and policy statements, especially the further impact on the Canadian dollar.
Technical analyst interpretation:
From a technical perspective, the current trend of the US dollar/Canadian dollar has formed a downward triangle shape. The upper boundary of this form is connected to the high point of 1.4380 on February 9th, while the lower boundary is composed of the low point of 1.4150 on February 14th. The descending triangle shape usually indicates that the market oscillates within a narrow range until the price breaks through the upper and lower boundaries of the triangle.
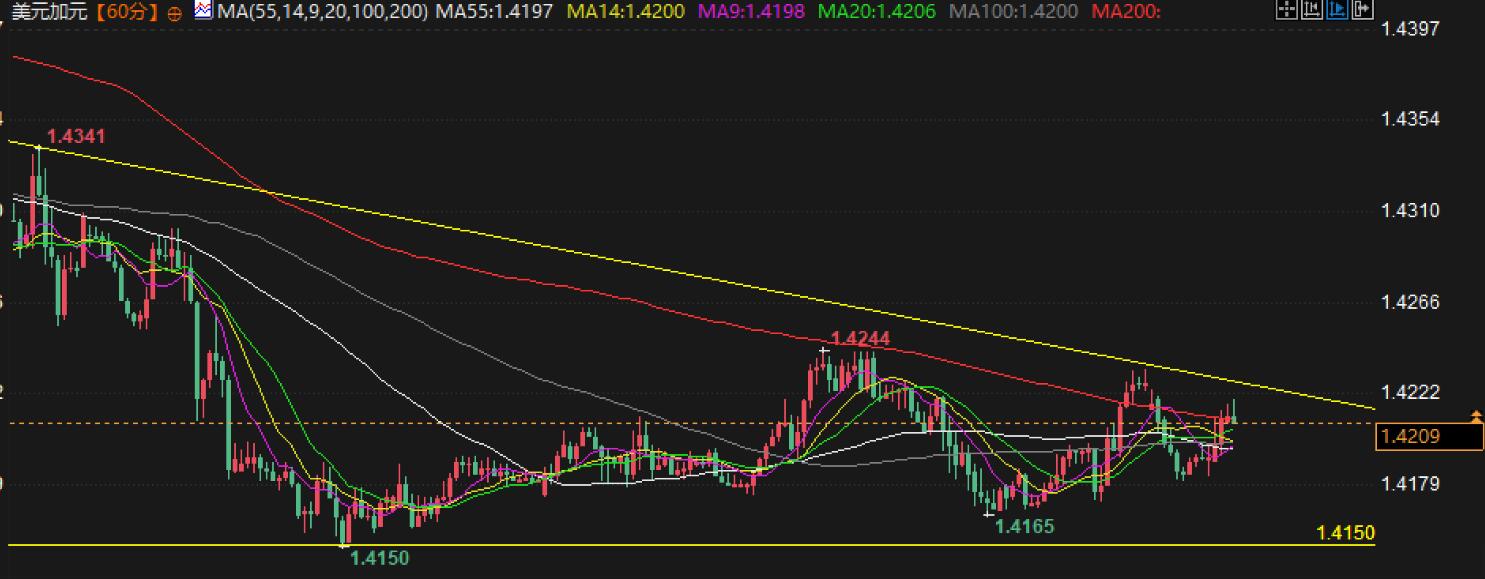
In terms of support, if the price falls below the low of 1.4150 on February 14th, it may trigger further downward trend. The downward target is first the low point of 1.4094 on December 9th, and further support may approach the low point of 1.4020 on December 6th.
On the contrary, if the price breaks through the high of 1.4244 on February 19th, it may experience a rebound. After breaking through, the price is expected to challenge the integer level of 1.4300, and even surpass the high of 1.4380 on February 9th, further expanding the upward space.
Based on the Bollinger Bands indicator, the current price is close to the upper limit of the Bollinger Bands. If the price breaks through the upper limit of the Bollinger Bands, it may provide momentum for upward movement and challenge higher resistance levels.
From the MACD indicator, both the fast and slow lines are currently above the zero axis, indicating that there is still some buying momentum in the market. Despite the volatile consolidation of prices, the support of MACD suggests that a short-term upward trend may be maintained.
Conclusion:
From a technical perspective, the US dollar/Canadian dollar is currently in a volatile range, forming a downward triangle shape, and may fluctuate within the range of 1.4150 to 1.4380 in the short term. If the price falls below 1.4150, it may accelerate its downward trend, with targets pointing towards support levels of 1.4094 and 1.4020; If the price breaks through 1.4244 and overcomes upward pressure, there may be room for a rebound of 1.4300 and 1.4380.
Tips:This page came from Internet, which is not standing for FXCUE opinions of this website.
Statement:Contact us if the content violates the law or your rights