Technical analysis of USD currency pairs: USD index, USD/JPY, NZD/USD, GBP/USD
On Wednesday (August 14th) during the European trading session, the US dollar hovered around a one week low. Traders are betting that the release of US consumer price data later today will lead to a rate cut by the Federal Reserve next month, while the pound has fallen after the release of lower than expected inflation data.
The New Zealand Federal Reserve has lowered the key overnight lending rate and hinted at more interest rate cuts in the future, which is a sharp dovish shift. As a result, the New Zealand dollar fell by about 1%.
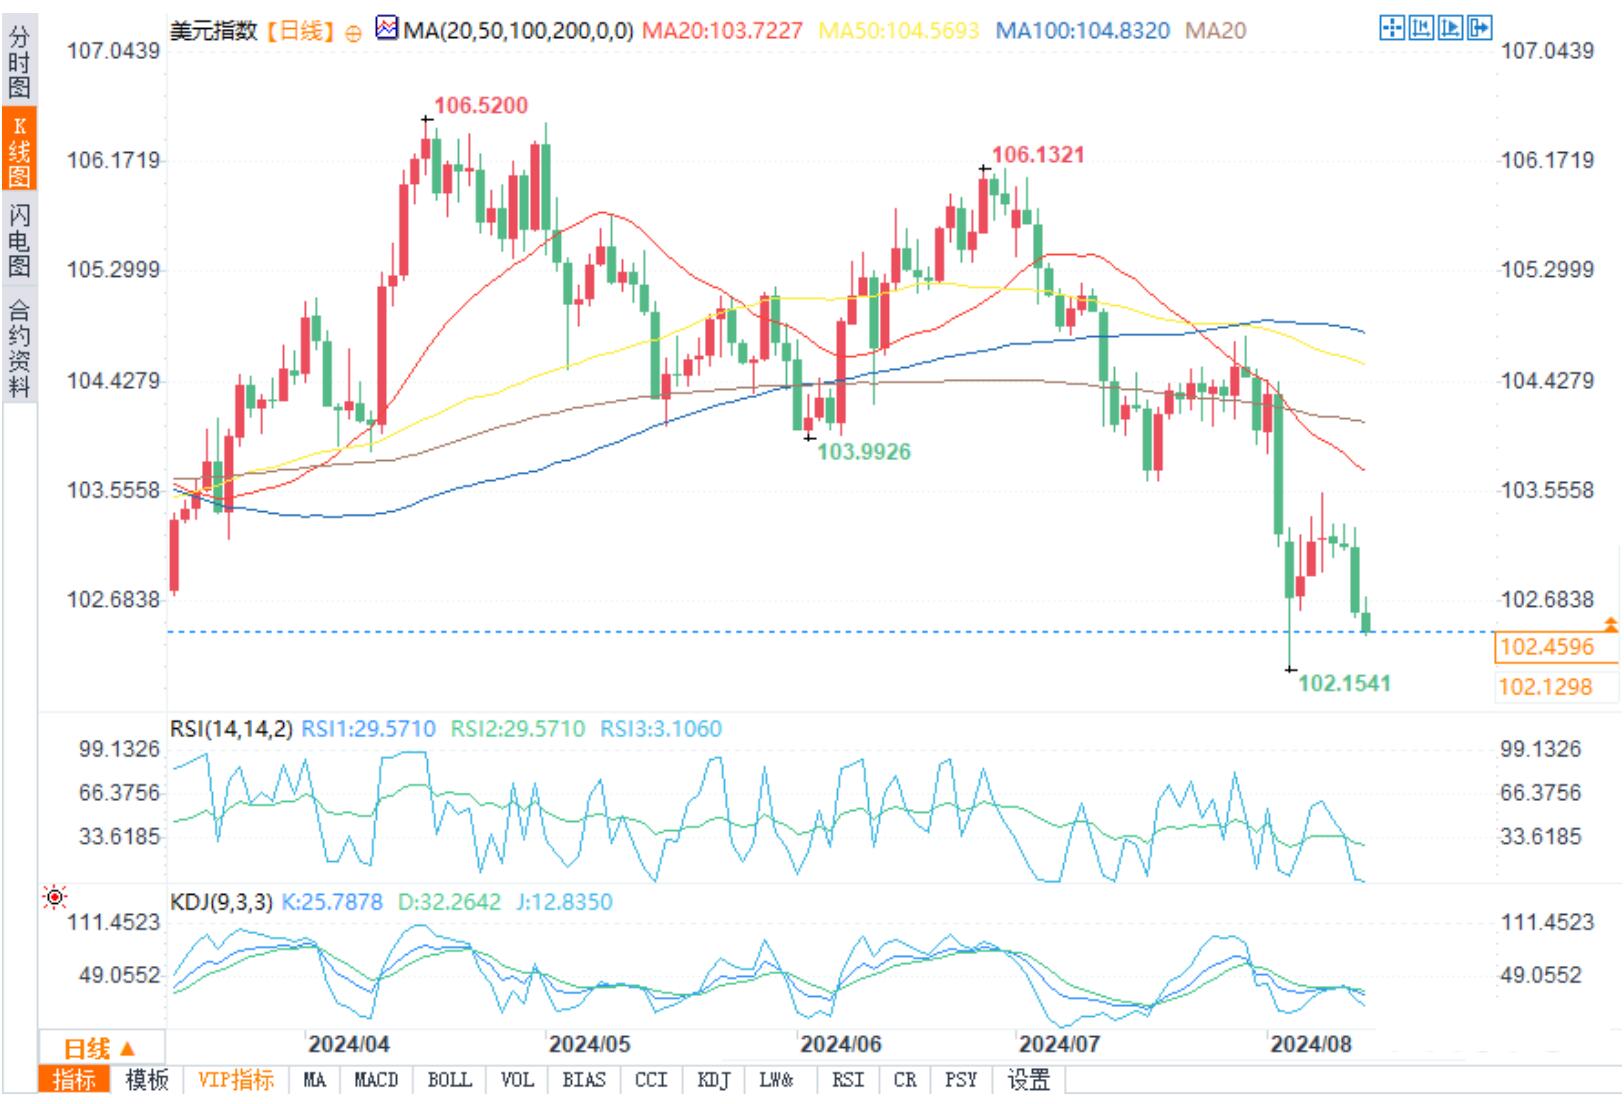
Daily chart of US dollar index
Before the release of US inflation data at 20:30 Beijing time, traders were generally cautious and expected the data to show a 0.2% month on month increase in the Consumer Price Index (CPI) in July, followed by a 0.1% decrease in June.
The US dollar index, which measures the exchange rate between the US dollar and other major currencies, fell 0.15% during trading to 102.4572. The US dollar index fell 0.5% on Tuesday due to a slower than expected increase in the Producer Price Index (PPI), boosting hopes of a US interest rate cut next month.
Volkmar Baur, a foreign exchange analyst at Commerzbank, said, "Traders are preparing for weak CPI numbers, which of course carries the risk that if CPI meets expectations or is slightly stronger than expectations, the US dollar will strengthen again. If CPI unexpectedly weakens, the Federal Reserve should not waver in the direction of a 50 basis point rate cut, as inflation is a lagging indicator and a slight weakness in CPI is not a signal of an imminent economic recession
Prior to the release of producer price data, traders had widely anticipated that the Federal Reserve would cut interest rates in September. According to the Chicago based FedWatch Tool, their bets showed that the likelihood of a 50 basis point rate cut had increased from 50% the day before to 52.5%.
The sideways trend of USD/JPY may suddenly come to an end
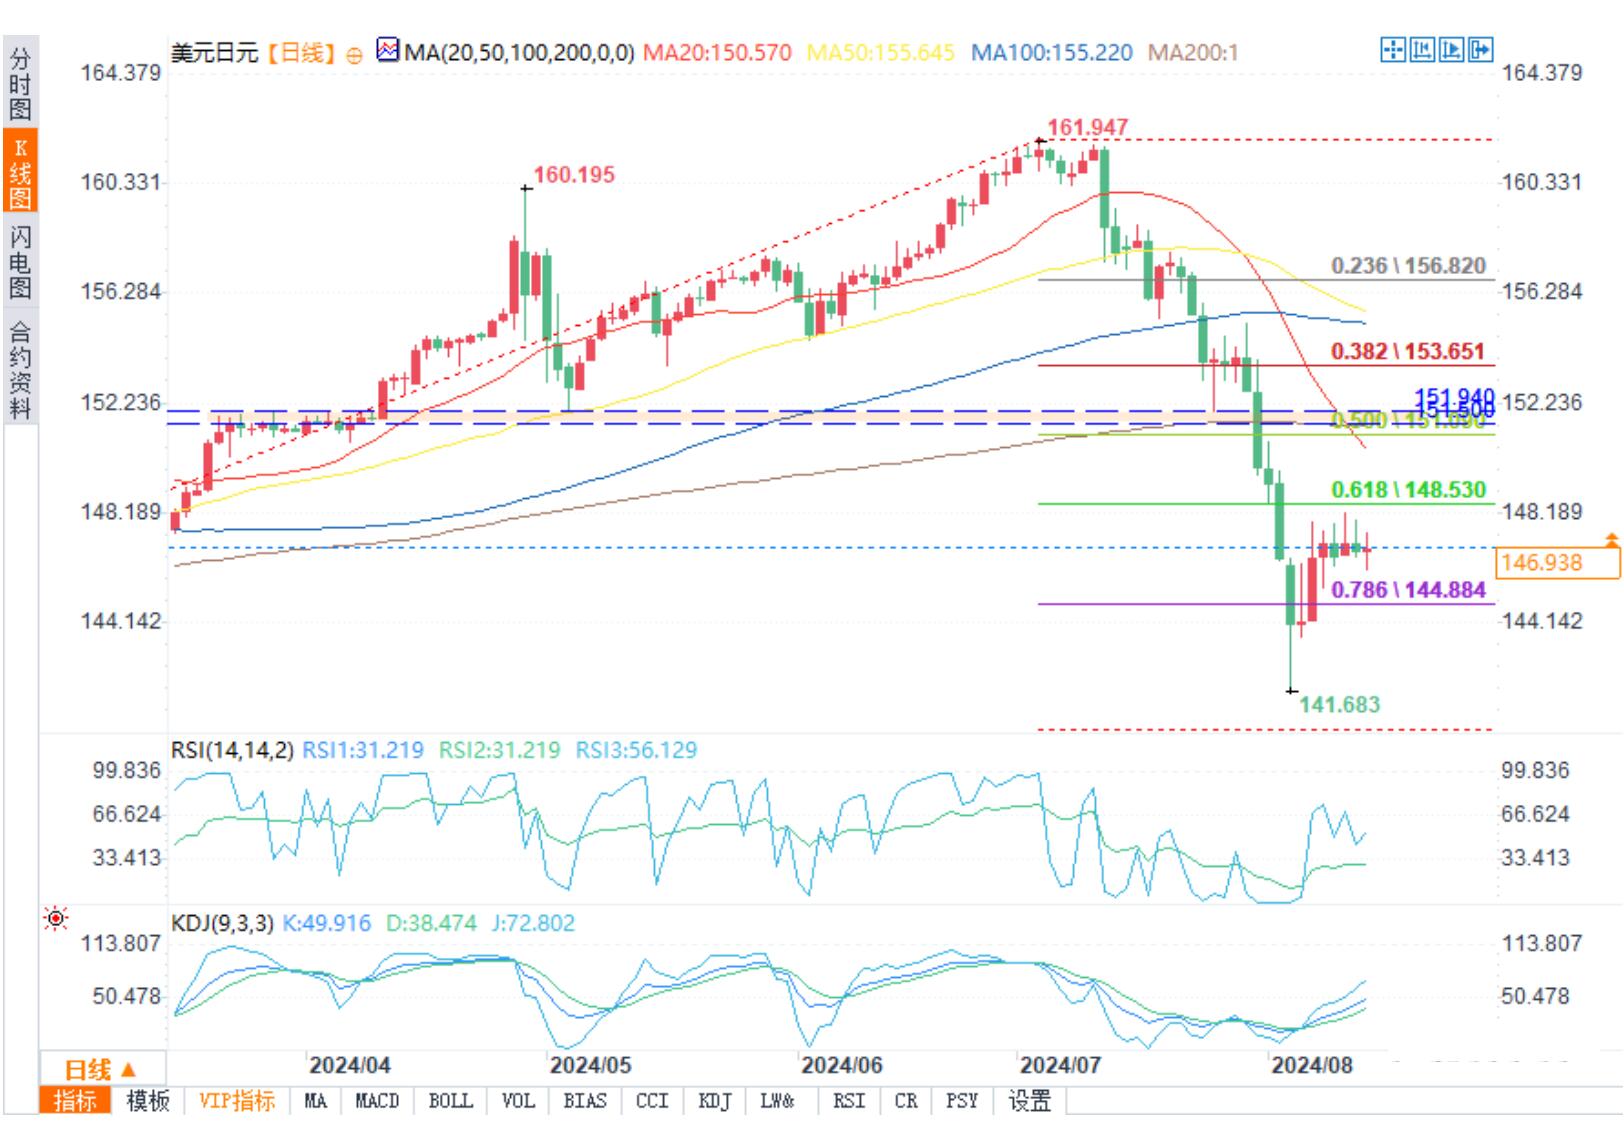
USD/JPY daily chart
The US dollar/Japanese yen continued to trade sideways, hovering around the 146.65-147.71 range for the fifth consecutive trading day. Bears held most of the gains from the significant pullback from the high of 161.94 in early July, but failed to capitalize on the recent underperformance of the US dollar.
As traders digest the news of the resignation of Japanese Prime Minister Fumio Kishida overnight, the focus gradually shifts to today's US CPI report. This data may play a key role in prompting the Federal Reserve to shift towards a dovish stance at the upcoming Jackson Hole Symposium, thereby confirming the expectation of a rate cut in September.
At the same time, momentum indicators are mixed. Specifically, although the US dollar/Japanese yen has recently risen slightly, the relative strength index is still below the midpoint, indicating significant bearish pressure on the US dollar/Japanese yen. Interestingly, the Average Directional Movement Index (ADX) continues to hover above the threshold of 25, indicating a mild bearish trend in the USD/JPY exchange rate. More importantly, the random oscillation indicator has successfully climbed over the overbought zone (OB), but it may have run out of fuel as it is currently trading sideways.
If bears still have confidence, they may first try to push the USD/JPY below the 146.65-147.17 area, which is a previously intensive trading zone located at the 78.6% Fibonacci retracement level of the downtrend from October 21, 2022 to January 16, 2023 and the high on August 11, 1998. If the market continues to weaken, bears may sell again towards the 144.99 level and gradually prepare to retest the 61.8% Fibonacci retracement level of 142.49.
On the other hand, bulls are desperately searching for another small increase above the 146.65-147.71 region. The rise may cause the US dollar/Japanese yen to rise towards its high of 150.15 on October 3, 2023, with the next possible target being the busy 151.45-115.94 region.
In summary, the relative calm of USD/JPY may not continue as the market prepares for some key US data releases.
NZD/USD hits bottleneck at 200 day moving average
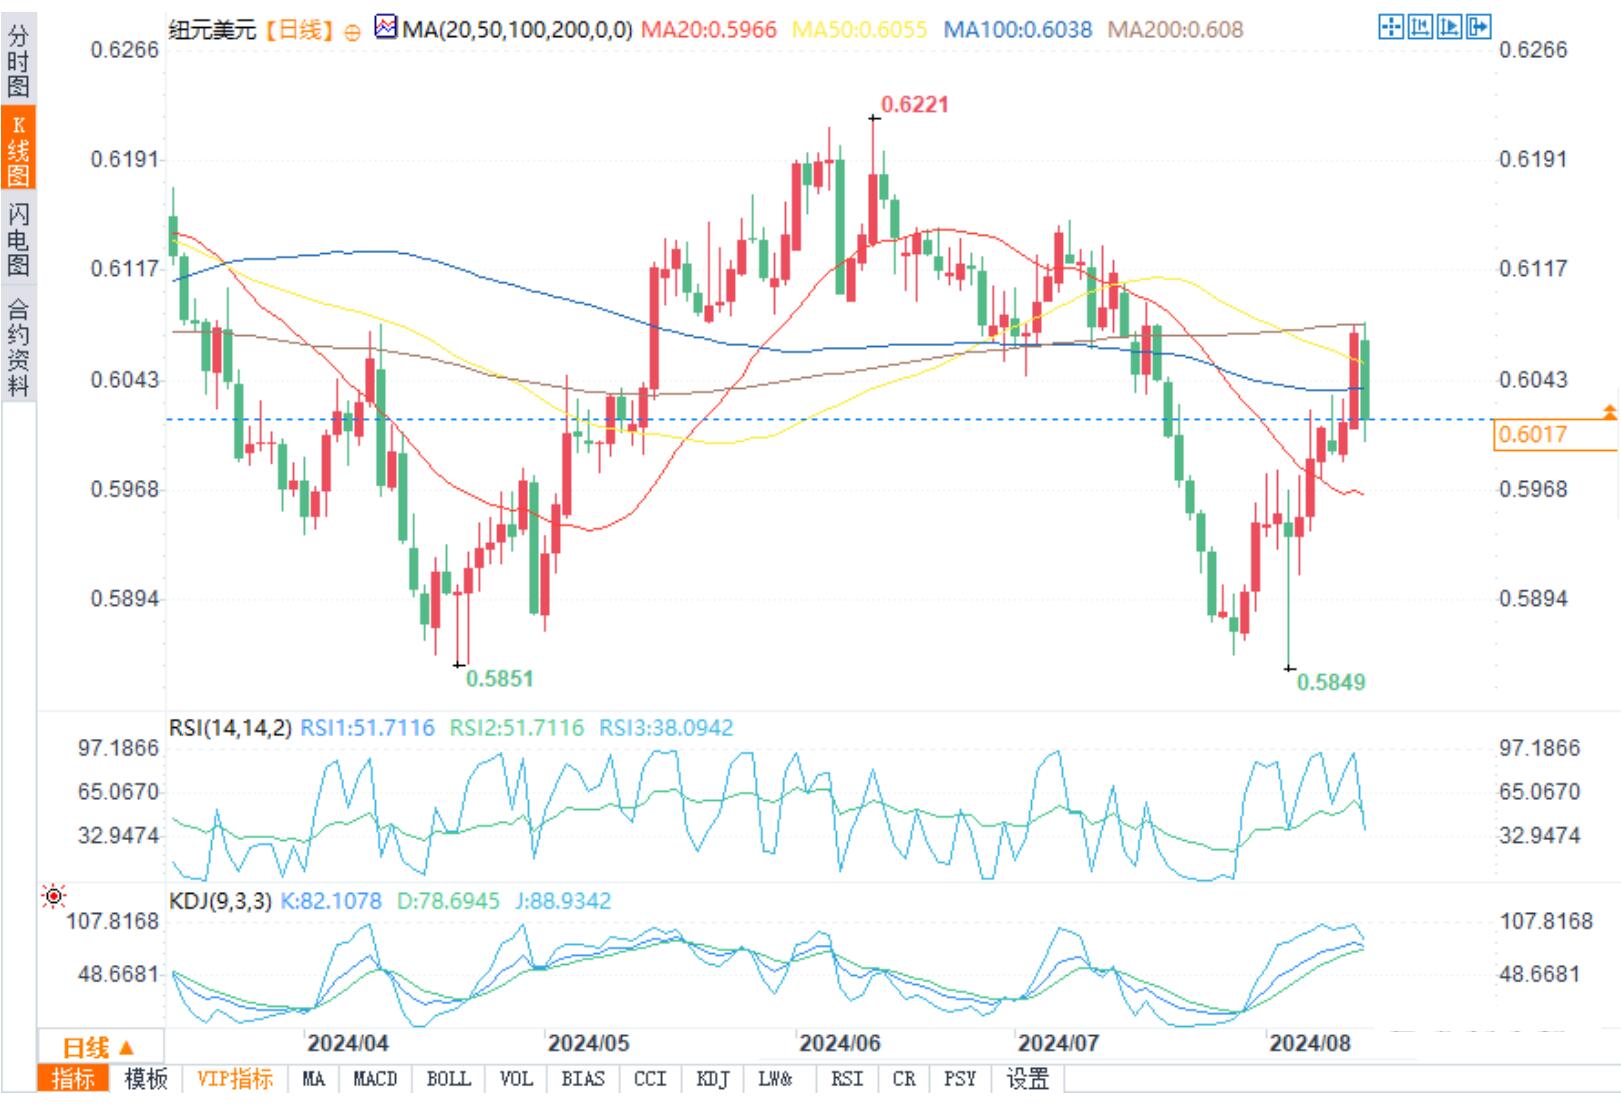
NZD/USD daily chart
On Wednesday (August 14th), the Reserve Bank of New Zealand lowered its official overnight lending rate (OCR) by 0.25 percentage points, marking the first relaxation of policy since the beginning of 2020, one year ahead of its own expectations. Afterwards, the New Zealand dollar/US dollar fell sharply by 1.2%, with the latest drop of 1.1% to $0.60060.
The Reserve Bank of New Zealand has cut interest rates by 25 basis points and even considered cutting rates by 50 basis points, putting the brakes on the sharp recovery of the New Zealand dollar/US dollar. Therefore, bulls need to decisively break through the 200 day moving average in order to regain confidence in a comprehensive recovery.
IG market analyst Tony Sycamore said, "The Reserve Bank of New Zealand has completed a 180 degree dovish backflip, cutting interest rates just three months after raising the possibility of further rate hikes, bringing much-needed easing to households and businesses
Since the beginning of this month, the New Zealand dollar/US dollar has been steadily recovering, having previously established a foothold near the 2024 low of 0.5851 reached in April. However, the rebound paused at the 200 day Simple Moving Average (SMA), and Tuesday's mild interest rate decision by the Reserve Bank of New Zealand helped the bears.
If the recent uptrend turns into a reversal, the initial support level may be at 0.5972, which is the 23.6% Fibonacci retracement level of the 0.6368-0.5851 downtrend. If it fails to stop here, the currency pair may fall to the support level of 0.5938 in April. Breaking through this range may pave the way for the bottom of 0.5848 points in 2024, which remained strong in April and August of this year.
On the contrary, bullish behavior may cause the price to test the 38.2% Fibonacci level of 0.6048 before the 50 day and 200 day moving averages. Defeating the latter, the bulls may attack the 50.0% Fibonacci 0.6109. If the market continues to rise, further gains may stop around the Fibonacci level of 61.8% at 0.6170.
GBP/USD technical indicators may rise to 1.30
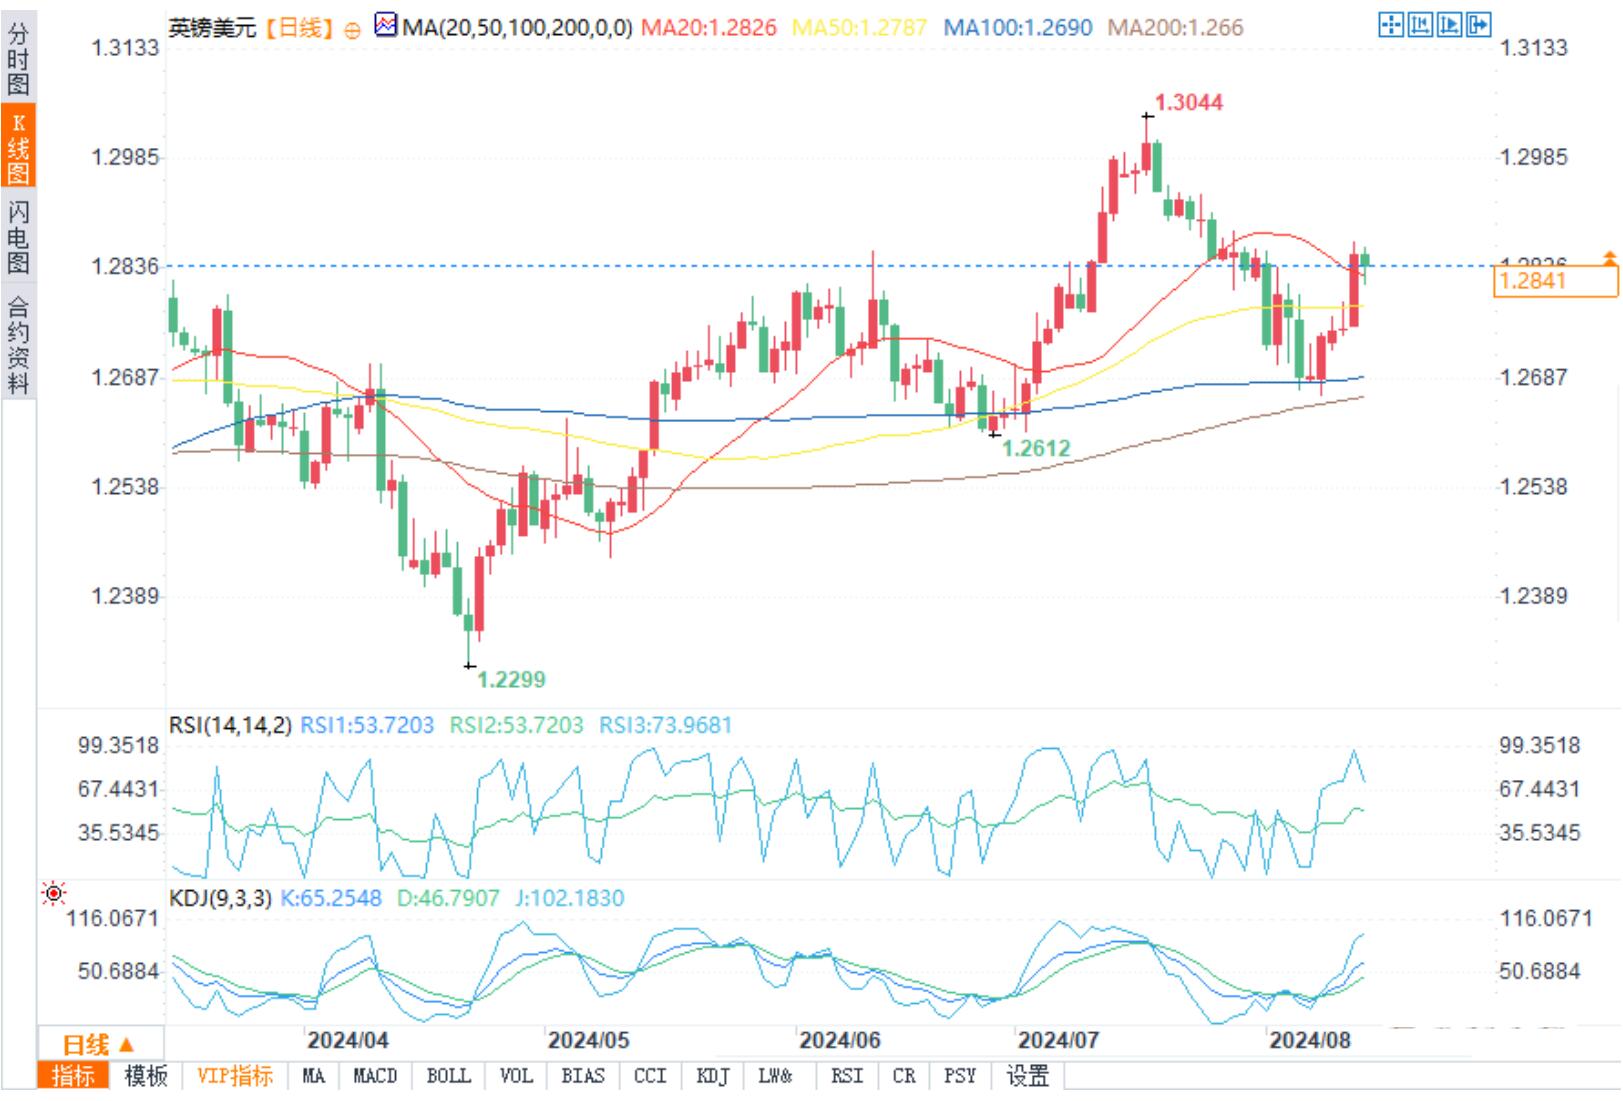
GBP/USD daily chart
The pound fell on Wednesday, as the previously announced UK consumer price inflation rate was lower than expected, supporting expectations that the Bank of England will further cut interest rates this year.
GBP/USD fell 0.12% to 1.2844 during trading. Previously, data showed that consumer price inflation in the UK rose for the first time this year in July, but the increase was smaller than expected due to a smaller increase in service prices. Service price inflation is an indicator closely monitored by the Bank of England.
According to the money market, traders currently predict that the Bank of England will cut interest rates by about 46 basis points this year, with little change compared to Tuesday's level. The probability of a rate cut in September is about 48%.
Official data shows that consumer prices in the UK rose to 2.2% in July, but lower than the 2.3% predicted by economists. Previously, it remained at the Bank of England's target level of 2% for two consecutive months. The service price inflation rate in July decreased from 5.7% in June to 5.2%, lower than the Reuters survey forecast of 5.5% and the lowest level since June 2022.
Kyle Chapman, a foreign exchange market analyst at Ballinger Group, said, "Given yesterday's employment report gave mixed signals and an inflation report before the September meeting, there is still a lot of suspense about the next decision. Nevertheless, I expect the Bank of England to pause interest rate cuts at the next meeting, wait for more data, and then take action in November, possibly even in December
Baur from Deutsche Bank stated, 'We believe this is still in line with a stabilizing inflation situation, rather than further inflation slowdown. We expect the Bank of England to be more cautious than the Federal Reserve and the European Central Bank, as inflation in the UK seems to be more stubborn and the economic cycle seems to be accelerating again.'.
The pound has recently found support in the daily cloud layer, causing the exchange rate to climb. The daily cloud map is rising and currently spans the area of 1.2653-1.2734. On Tuesday, the spot exchange broke through and closed above the moving average of 1.2855. If the daily chart closes above the one eye equilibrium benchmark again, the increase may be even greater, which could potentially rise to the psychological level of 1.3000. However, bulls should pay attention to the slightly negative momentum indicators on the 14th.
The pound may react to next weekend's speech by Bank of England Governor Andrew Bailey, especially if he provides guidance on the possibility of another rate cut by the Bank of England in September. Bailey will give a speech at the Federal Reserve's Jackson Hole meeting in Wyoming on August 23 at 1900 GMT.
If Bailey suggests that the Bank of England may cut interest rates again as early as next month, the pound may fall; If he indicates that he is more likely to remain inactive, the pound may strengthen.
Tips:This page came from Internet, which is not standing for FXCUE opinions of this website.
Statement:Contact us if the content violates the law or your rights