Silver technology is bullish!
The silver price has erased recent gains and is currently trading at around $27.65. Market analyst Akhtar Faruqui stated that daily chart analysis shows a breakthrough in prices above the downward triangle shape, which is considered a positive signal. This breakthrough indicates that the market may be shifting from bearish to bullish.
On the 14th, the Relative Strength Index (RSI) was consolidating below 50, showing a downward trend. Breaking through the level of 50 will indicate the emergence of an upward trend.
In addition, the Moving Average Convergence Backline (MACD) has crossed above the signal line, indicating the possibility of a bullish signal. However, as both lines are below the centerline, this indicates that the overall trend is still bearish. It may be wise to wait for further confirmation before making any significant trading decisions.
In terms of support, silver prices are testing the upper boundary of the downward triangle around $27.75. Returning to the downward triangle will strengthen bearish sentiment, pushing silver prices towards the vicinity of $26.60, followed by the May low of $26.02.
On the upward trend, the initial resistance level of silver prices is near the 14 day moving average (currently at $27.78), followed by the $28 mark and $28.60 mark. If the silver price breaks through the resistance of $28.60, it may test the area near the two month high of $31.75.
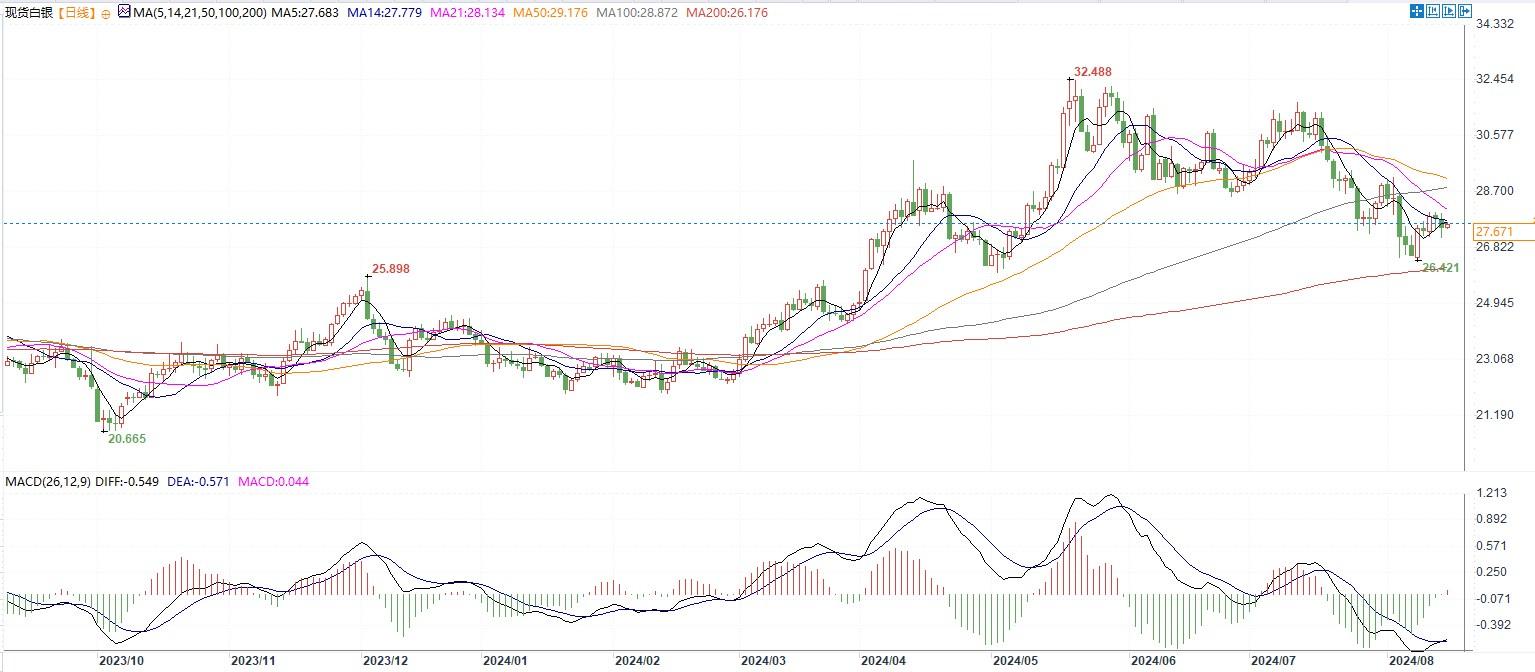
Daily chart of spot silver
Tips:This page came from Internet, which is not standing for FXCUE opinions of this website.
Statement:Contact us if the content violates the law or your rights