Spot Gold Technical Analysis: Gold Soars to Historical High
technical analysis
If the recent rise in spot gold continues, bulls may test 2514 points upwards, which is the 123.6% Fibonacci extension of the July 2483-2352 downtrend. A decisive breakthrough above this region may lay the foundation for the 138.2% Fibonacci extension at 2533 points. If the price does not stop here, gold may further test the 161.8% Fibonacci extension of 2564.
On the contrary, in the case of a downturn reversal, direct support can be found at the high point of 2483 in July. Further decline may stop at 61.8% of 2433 points, which also provided support in August. If the market continues to weaken, 38.2% of 2402 may suppress the downward trend of gold.
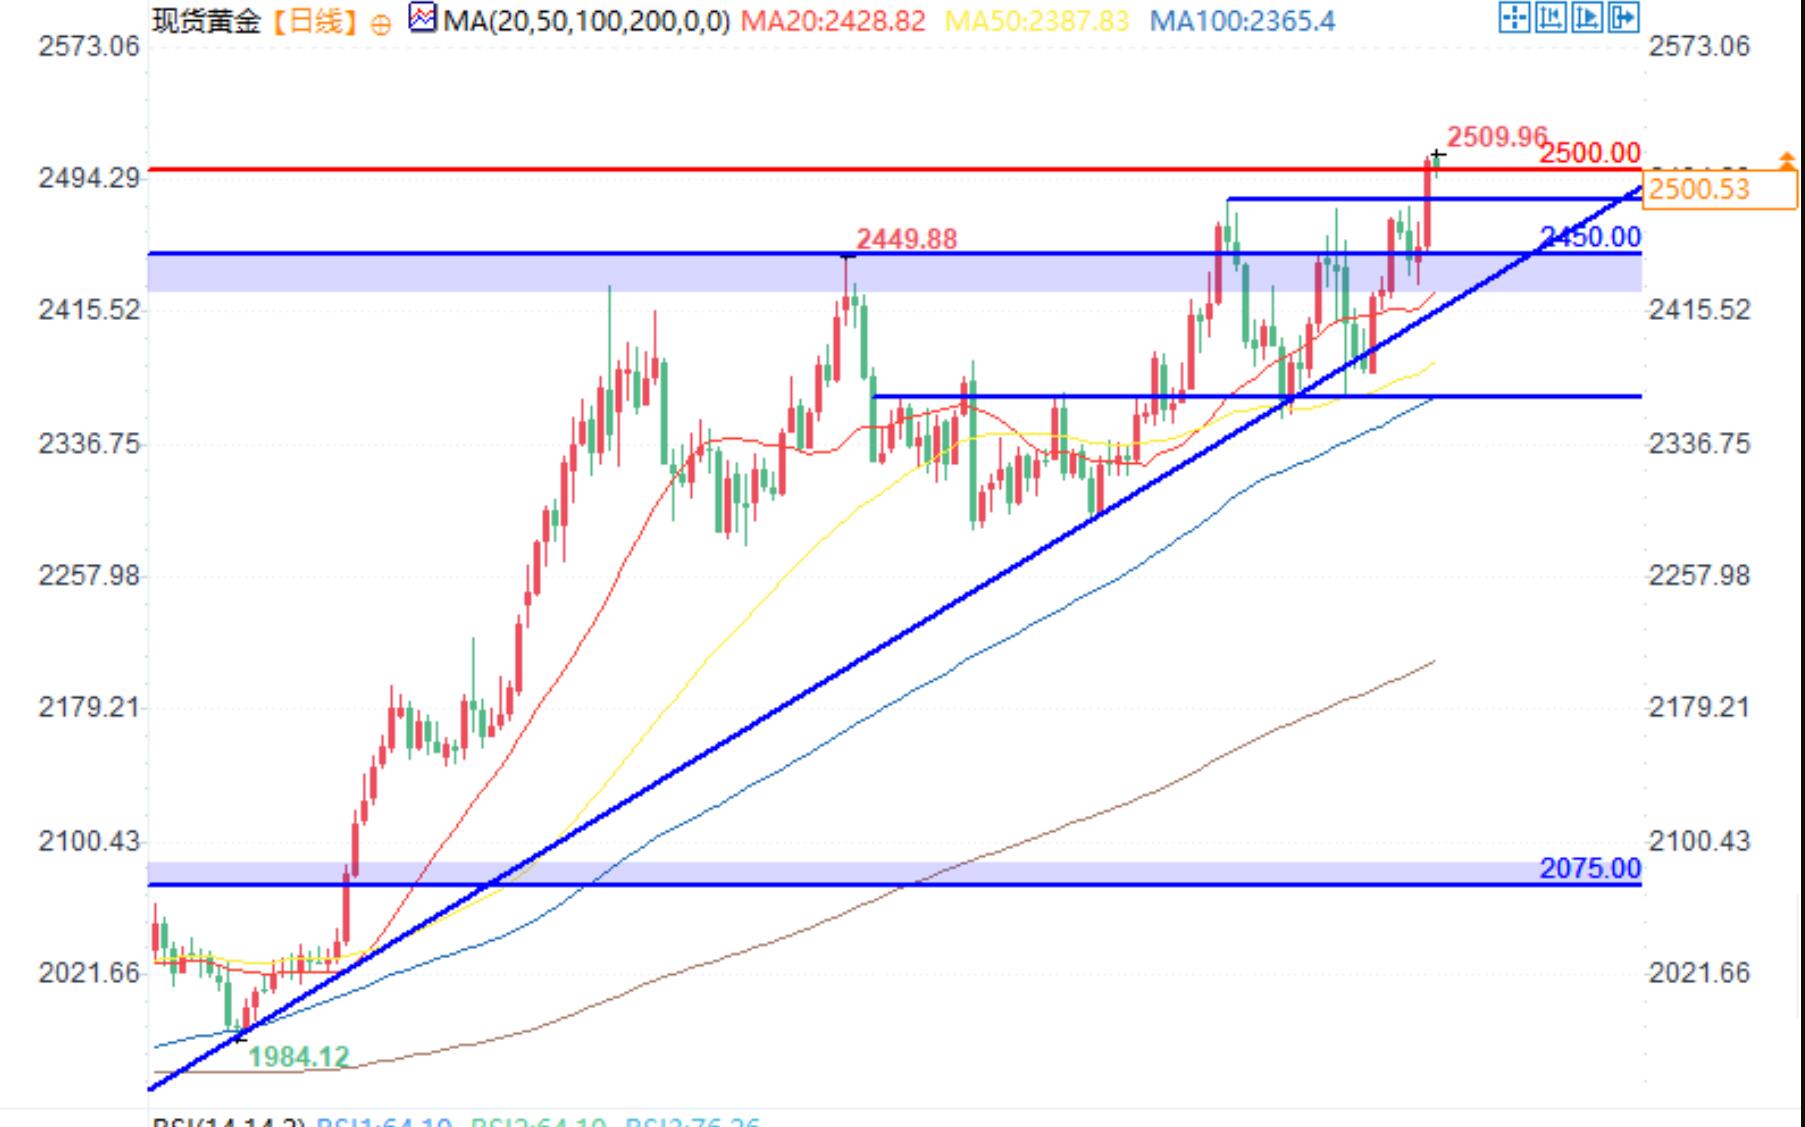
In summary, gold set a new historical high in today's trading and subsequently gave up some of its gains. However, considering that short-term oscillation indicators have not shown any signs of rebound or decline, the upward trend may recover.
Tips:This page came from Internet, which is not standing for FXCUE opinions of this website.
Statement:Contact us if the content violates the law or your rights