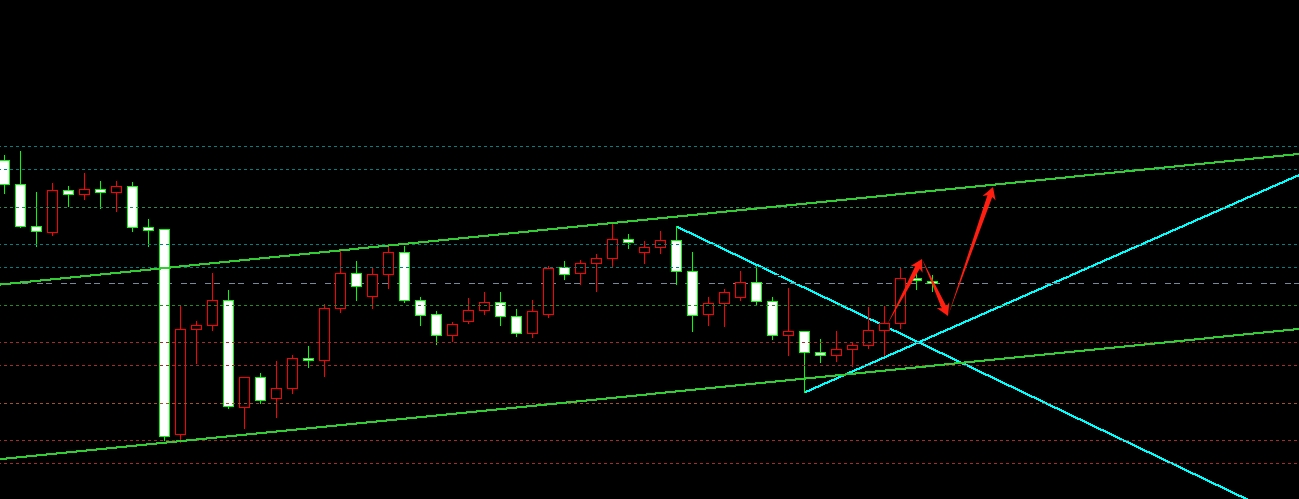
1.2, gold bottomed out and rebounded, buying on dips in the Asian market
On Tuesday, gold failed to continue Monday's decline and rebounded with a drag of 02. However, the pace was still consistent with Monday and last Friday. The price first hit the side pressure line of 2617 to form a downward wave of suppression. After falling back four hours, it broke through the side pressure and reached the high point of Monday again at the end of the trading day. Finally, it went back and forth, so overall it was a broad oscillation. Looking ahead, the long and short trends in the first three trading days were relatively fast, and the price only went through a top bottom transition. The daily chart closed with a small yang, although not swallowed up, it was basically close to the high level, and the form was somewhat similar to the previous wave of rise. The daily chart moved out of parallel horizontal operation and finally broke through upwards. For this individual, The view is the same, the lowest expected for Monday is 2588 first tier, The second target of 2596, which was given a short point at the lowest point during the trading session, overlaps closely with the previous wave of 2583 low point on the moving average on the weekly chart. Therefore, whether it can break through in the future depends on the closing of this week. However, this is only a prediction and has little significance for intraday operations. The four hour wave broke through the upper line to suppress the bearish trend on the medium-term moving average, and on Tuesday it rebounded from the bottom to the strong trend. The price is still running in the downward channel, with some room for improvement from the sideline. In terms of form, it is still bullish. On the hourly chart, there is a weak bearish trend at the high level, but structurally it is in a volatile weak bearish position. The 30 minute bottom and rebound structure has already formed a bullish pattern. Therefore, combined with the four hour wave, Today, the daily chart started with buying on dips, followed by the hourly chart breaking through the acceleration line and then falling back to follow suit, As for waiting empty for four hours before participating.

In terms of operation, reference support 2617-08 is used in conjunction with 5-15 minute signal entry, and the upper reference suppression 33-38-42-58 span is used to suppress the intraday wave amplitude (2608-2658)
GBP/JPY: The daily chart has undergone a correction wave, with weak short positions appearing but not fully formed. A rebound signal has been formed at the low level in four hours, so today's expectation is to rise first and then fall, with reference to 196.5 for the upper and lower levels and 198-198.3 for the upper level suppression
Crude oil: bullish and unchanged. Although there were short adjustments from Friday to Monday and Tuesday, the daily chart's upward structure did not change in the end. Therefore, we will continue to buy on dips to support the intraday reference of 71-70.3
The above ideas are for reference only. There are risks in the market, and investment needs to be cautious.
Tips:This page came from Internet, which is not standing for FXCUE opinions of this website.
Statement:Contact us if the content violates the law or your rights
