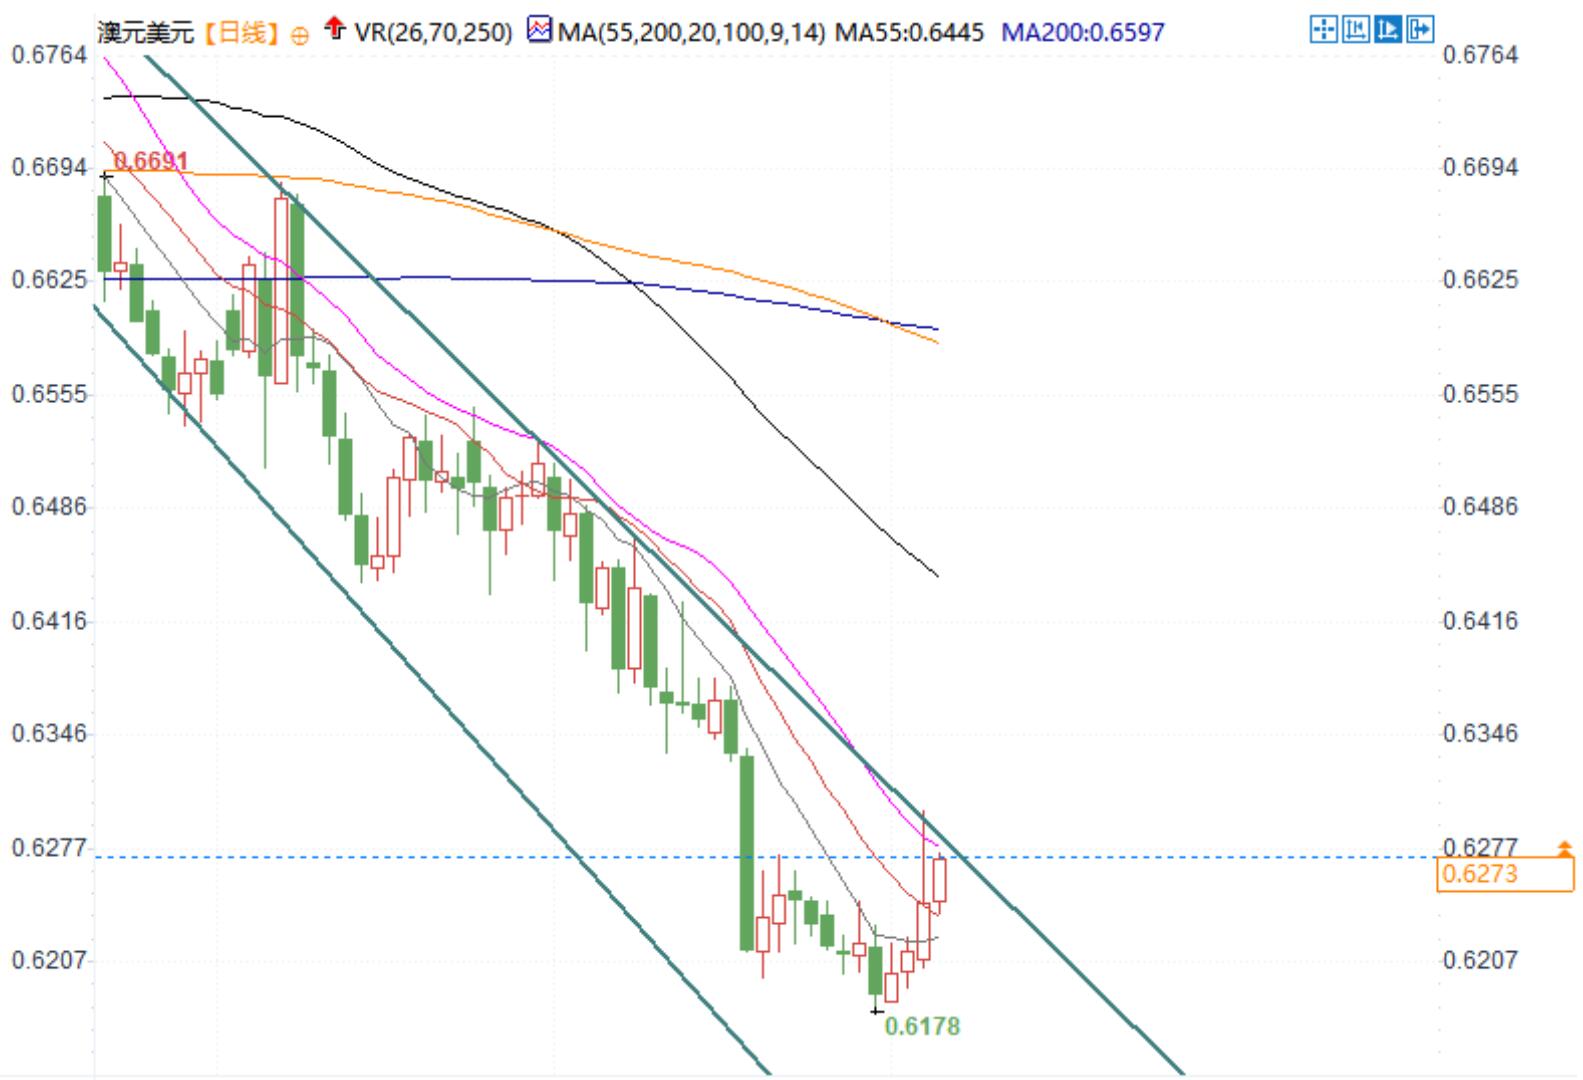
Foreign exchange trading analysis: Can the strong rebound of the Australian dollar break through the resistance of 0.6280?
Prior to the European market on Tuesday (January 7th), the AUD/USD rose for the fourth consecutive trading day, despite weaker than expected building permit data for November in Australia, the AUD/USD remained strong. According to data from the Australian Bureau of Statistics, the number of building permits in November decreased by 3.6% month on month to 14998 units, while market expectations were for a 1.0% decline. The previous October data showed a 5.2% increase after an upward adjustment, marking the first decline in nearly three months.
Meanwhile, the market is closely monitoring the Australian November monthly Consumer Price Index (CPI) to be released on Wednesday. If the CPI data is lower than market expectations, it may exacerbate market expectations for the Reserve Bank of Australia to cut interest rates at its February meeting, which will put pressure on the Australian dollar.
The impact of Federal Reserve policies on the rise of the Australian dollar
Despite the hawkish policy outlook of the Federal Reserve, the performance of the Australian dollar remains strong. The US ISM Manufacturing Purchasing Managers' Index (PMI) recorded 49.3 in December, higher than November's 48.4 and market expectations of 48.4, indicating a weakened contraction in the US manufacturing industry. The US ISM Service PMI will also be released tonight, which is expected to have further impact on market trends.
In terms of policy prospects, Richmond Fed President Thomas Barkin stated that the benchmark interest rate should remain at a restrictive level until there is more confidence that inflation is returning to the 2% target. In addition, Federal Reserve Board members Adriana Kugler and San Francisco Fed President Mary Daly also emphasized the challenges the Fed faces in slowing down the pace of monetary easing.
Australian dollar economic resilience supported by PMI data: Australia's composite PMI for December was revised up from 49.9 to 50.2, indicating a third consecutive month of moderate growth in private sector output. This is mainly due to the performance of the service industry, while manufacturing output is still contracting. At the same time, the service sector PMI was revised upwards to 50.8, higher than November's 50.5, marking the 11th consecutive month of growth in the service sector. These data reflect that despite the complex global economic environment, the fundamentals of the Australian economy still exhibit some resilience.
In terms of technology, analyst Faruqui provided the following interpretation:
From a technical perspective, AUDUSD overall remains within the downward channel on the daily chart. Nevertheless, the relative strength index (RSI) on the 14th approached the 50 level, indicating that bearish momentum may be weakening.

In terms of resistance, AUDUSD may test the upper boundary of the descending channel, which is close to the psychological threshold of 0.6280. If the resistance level is breached, it may trigger further upward momentum.
In terms of support, AUDUSD is currently supported by the 14 day moving average (EMA), which is around 0.6245, followed closely by the 9-day moving average support at around 0.6229. If these supports are breached, further support may appear at the lower boundary of the downtrend channel, around the level of 0.6000.
From a medium to long-term trend perspective, the Australian dollar remains in a relatively significant bearish structure, although there are signs of rebound in the short term, the overall trend has not yet reversed. The market is closely monitoring the upcoming important economic data from Australia and the United States, especially the Australian CPI and Federal Reserve meeting minutes, which may provide clearer guidance for future trends.
Analysis of Key Technical Indicators
Relative Strength Index (RSI): The RSI gradually approaches the 50 level, indicating a weakening of bearish forces, which may indicate a short-term rebound momentum.
Moving Average (EMA): The 14 day and 9-day moving averages provide short-term key support, and if the price falls below these levels, it may trigger a larger pullback.
Psychological barrier and channel boundary: The key resistance area where the current price is close to 0.6280. If it can break through this area, it may confirm a short-term bullish signal. However, the lower boundary support level of 0.6000 remains a critical line of defense.
Tips:This page came from Internet, which is not standing for FXCUE opinions of this website.
Statement:Contact us if the content violates the law or your rights
