Spot gold may once again test resistance near historical high 2956
On Thursday (March 13th) during the Asian session, spot gold fluctuated and rose, hitting a two-week high of $2945.89 per ounce at one point, and currently trading at $2944.31 per ounce.
Reuters technical analysts supported on Thursday that spot gold may return to its historic high of $2956 per ounce hit on February 24th, as it has already broken through $2939, which is the final obstacle to reaching a historic high.
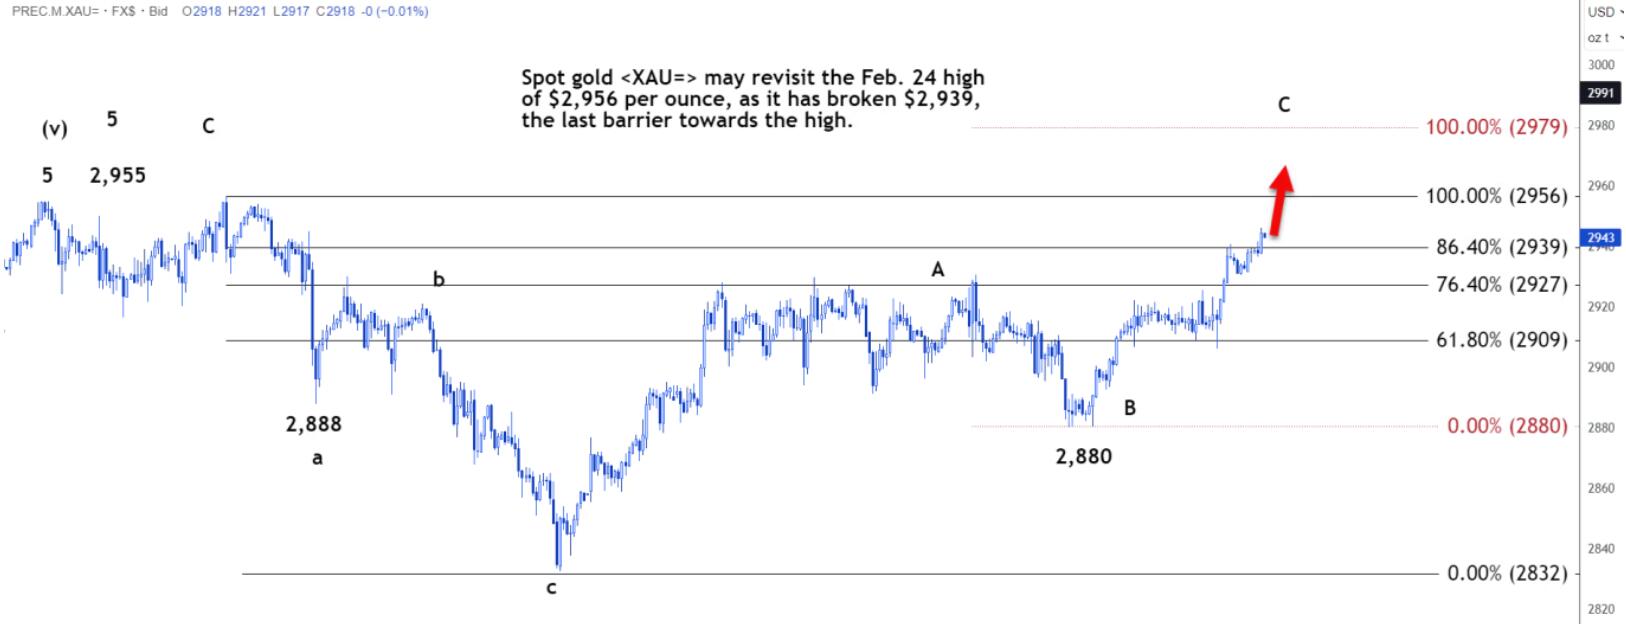
The wave pattern indicates that the C-wave starts at $2880 and can rise to $2979, which is the 100% projected level.
This wave looks as fierce as the previous A wave. Therefore, the correction from the current level may be limited to $2927.
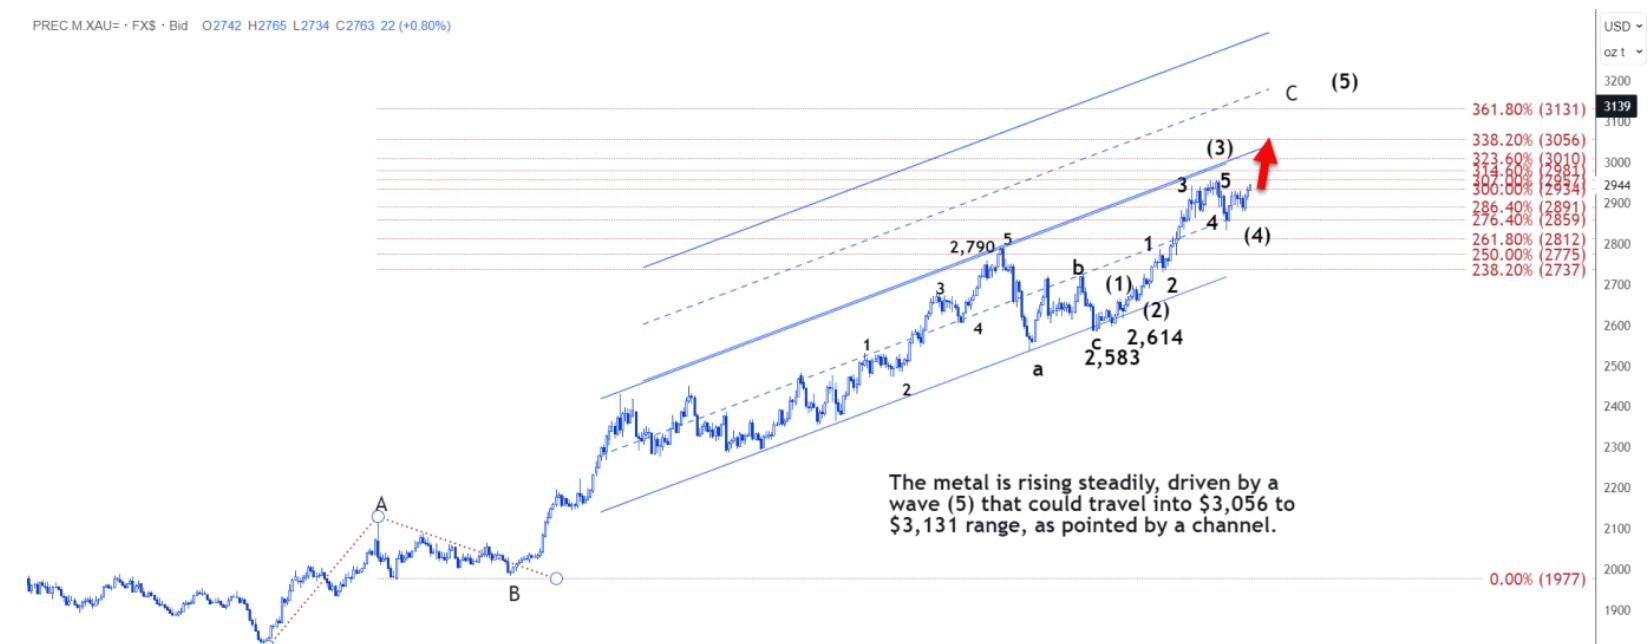
On the daily chart, the price of gold is steadily rising, driven by wave (5), and may enter the range of $3056 to $3131, as indicated by the channel.
In fact, breaking through $3010 may confirm that the market has exited the channel. The top repeating channel will point towards the target of $3400.
Tips:This page came from Internet, which is not standing for FXCUE opinions of this website.
Statement:Contact us if the content violates the law or your rights