The double bottom formation in gold is complete, and it will be difficult for prices to fall below 3300 in the short term
Recently, gold prices tested the support range of 3260-3270 four times before entering into a correction. Finally, on Monday (28th), the downward trendline was broken, with a closing price of 3343.87. which compensated for the decline on Friday. However, the rebound of the US Dollar Index in today's early trading hindered further advancement in gold prices. Currently, gold is priced at $3327 per ounce, with a daily decline of 0.49%.
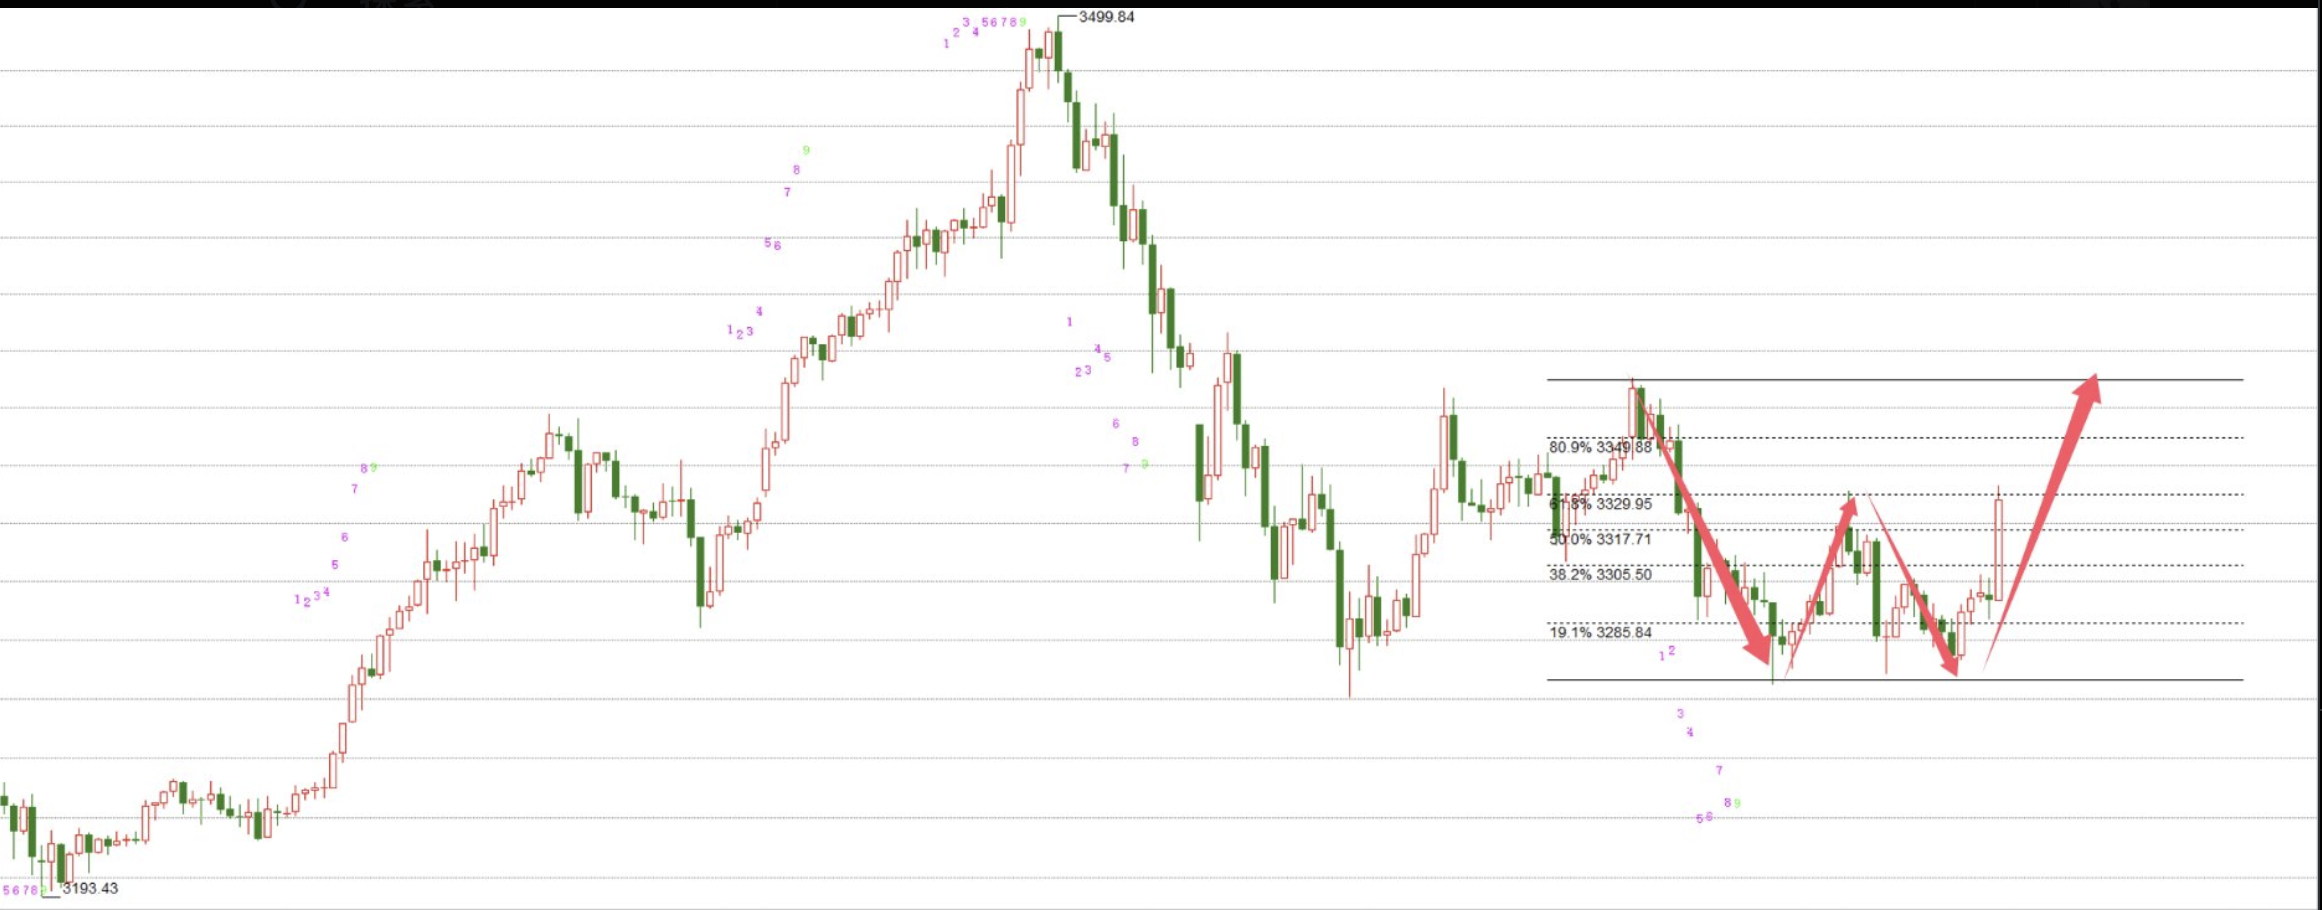
On the 1-hour chart, the EMA20 moving average has provided support to the market, and now prices have rebounded again. On the 15-minute chart, prices can be seen oscillating between 3333-3321. The market overall exhibits a W-shaped structure (double bottom), and it will likely test the top near 3360 in the future. In the short term, prices may not fall below 3300. so it is appropriate to initiate long positions between 3300-3310.
For intraday trading, resistance levels to watch are 3373 and 3404. while support levels are 3317 and 3293.
Tips:This page came from Internet, which is not standing for FXCUE opinions of this website.
Statement:Contact us if the content violates the law or your rights