Can gold withstand the strong crushing of the US dollar? The key support is about to be tested!
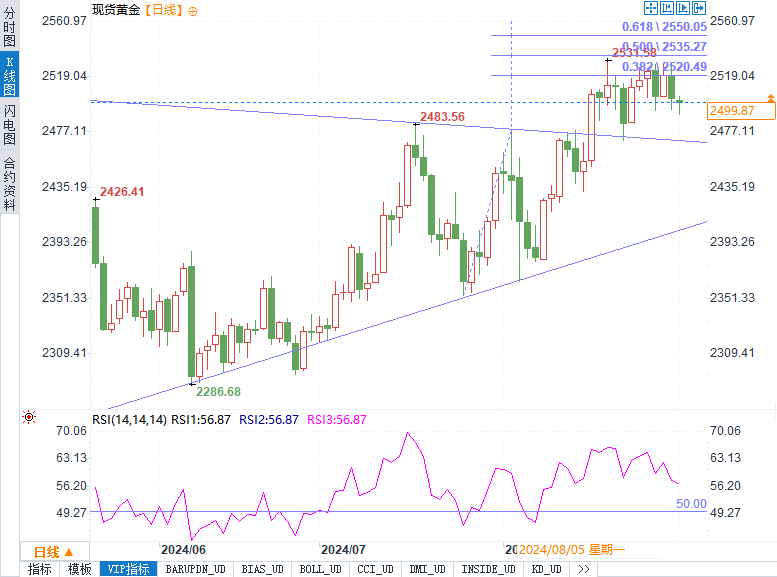
On Monday (September 2nd) during the European session, spot gold continued its downward trend from last week, and the price of gold continued to be under pressure, currently at $2496.44 per ounce. The gold price has further declined from last Friday's closing price of $2503.06 per ounce and has fallen below the critical psychological threshold of $2500. This trend was mainly affected by the stronger yield of the US dollar and US treasury bond bonds. Especially after the US PCE inflation data met expectations last Friday, the market's demand for the US dollar rose, leading to pressure on gold.
Double blow of strong US dollar and scarce liquidity
On Monday, coinciding with the US Labor Day holiday, the market liquidity was relatively thin, which further intensified the downward pressure on gold. Traders adjusted their positions in this relatively cold market environment to prepare for the important US economic data to be released later this week. These data include ISM manufacturing PMI, ADP employment changes, and non farm employment data, which are expected to have a significant impact on the future direction of the Federal Reserve's monetary policy.
Renowned institutional analyst Dhwani Mehta pointed out that as the gold price falls below $2500 per ounce, sellers in the gold market continue to take the initiative. In the current market environment, gold prices may further test the support level of $2475 per ounce. If this level is breached, gold prices will face greater downward pressure.
The corrective downward trend may continue
On a technical level, Mehta's analysis shows that although the overall upward trend still exists, the corrective downward trend of gold prices may continue. On the 14th, the Relative Strength Index (RSI) fell sharply and is currently close to the level of 50, indicating that the trend of weak gold prices is reasonable. If RSI continues to decline, gold prices may further explore the short-term support of the 21 day simple moving average (SMA) at $2475 per ounce.
At the same time, Mehta also mentioned that if the gold price falls below the support level of $2475 per ounce, the support level of $2463 per ounce in the symmetrical triangle will become the next key testing point. If this key support level is also breached, the gold market may initiate a new downward trend, and gold prices may further fall towards the $2420/ounce area, which is the intersection of the triangular support line and the 50 day moving average.

Tips:This page came from Internet, which is not standing for FXCUE opinions of this website.
Statement:Contact us if the content violates the law or your rights
