Analysis of the Trend of Foreign Exchange Gold and Crude Oil on February 13th
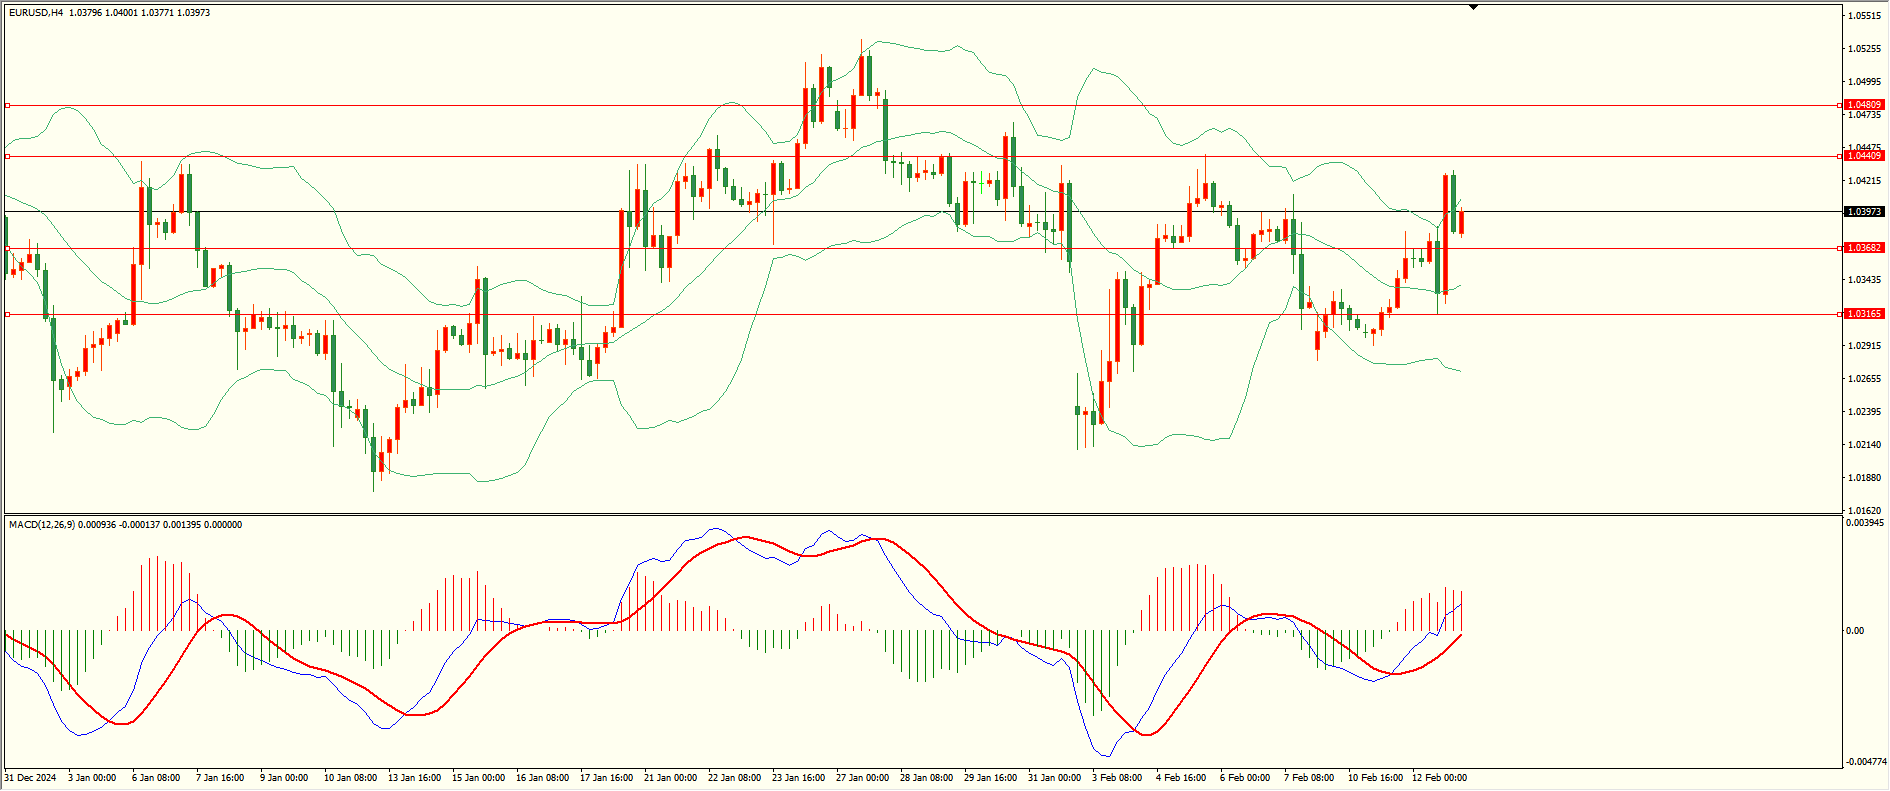
Yesterday, the EUR/USD retraced to the first support and continued to rebound. The daily chart closed at the upper and lower shadow lines with a bullish candlestick. From the closing point, it is currently close to the previous intensive pressure zone above, and can only continue after recovery. Combined with the 4H chart, the Bollinger Bands turned upwards, and the MACD zero axis is running. The main support for the day is 1.0365-75, the second support is 1.0315, and the upper resistance is 1.0440, 1.0480-90. It is expected to test the first resistance in the short term above the first support.
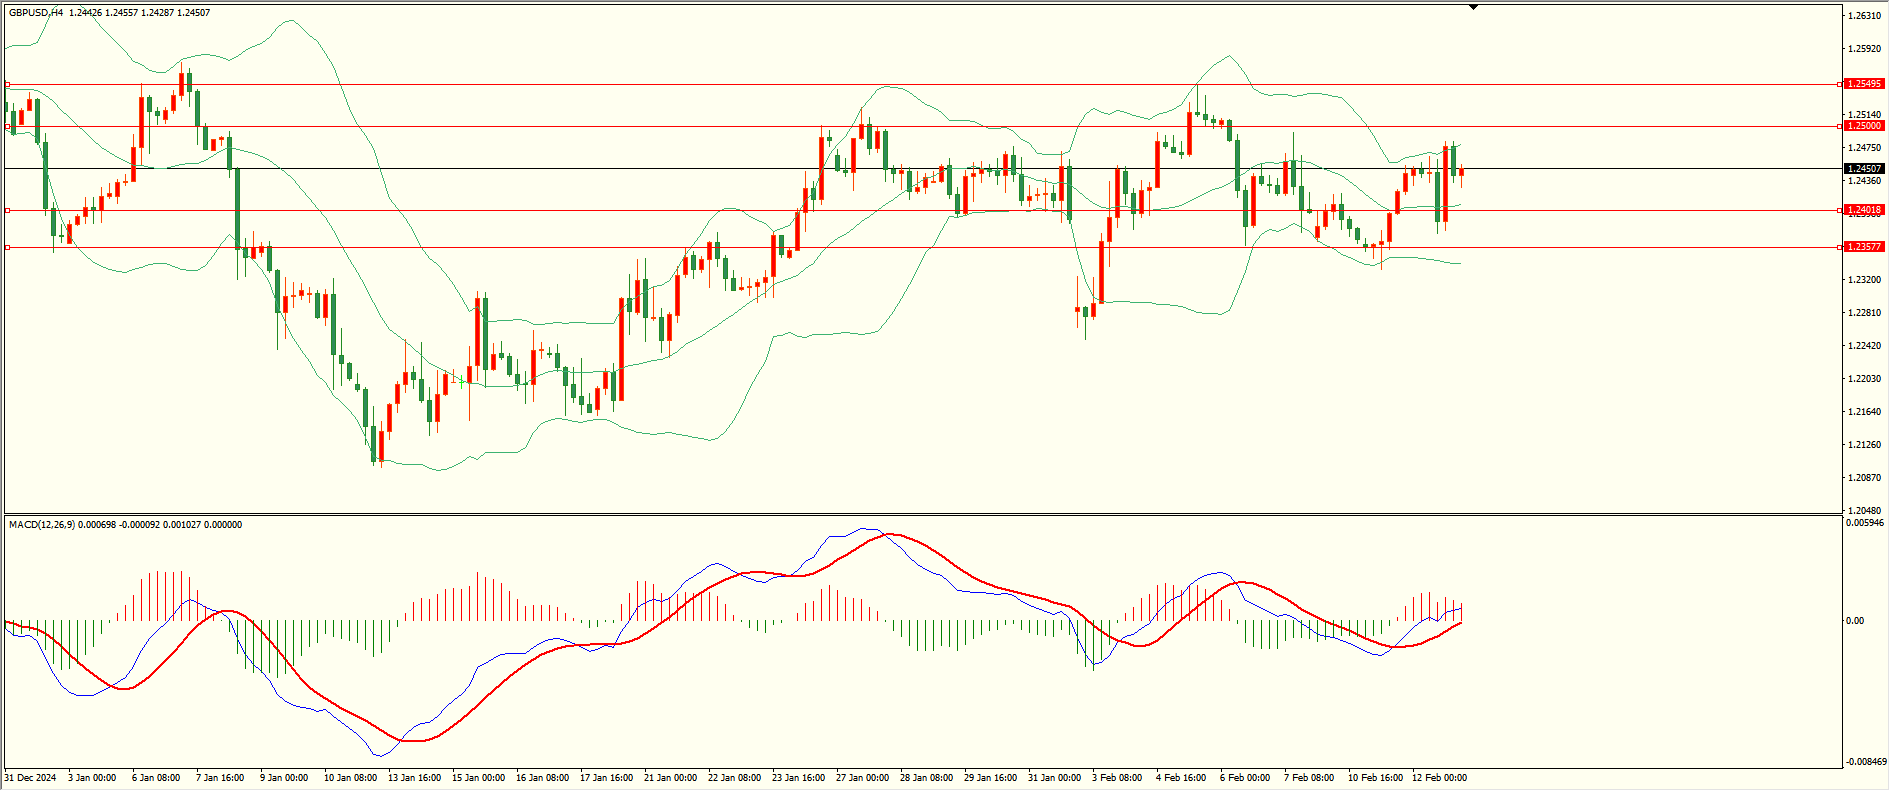
GBP/USD hit the bottom of the first support yesterday and fluctuated upwards. In the late trading session, it rebounded to the second resistance and rose and fell back. The daily chart closed at a cross star line, and the long short competition was relatively balanced. The daily oscillation has not yet ended. From the 4H perspective, the Bollinger Bands are above the middle limit, and the MACD is running near the zero axis. The main support for the day is 1.2400, the second support is 1.2355, and the upper resistance is 1.2500, 1.2550-60. The first support is expected to test the first resistance in the short term before it falls.
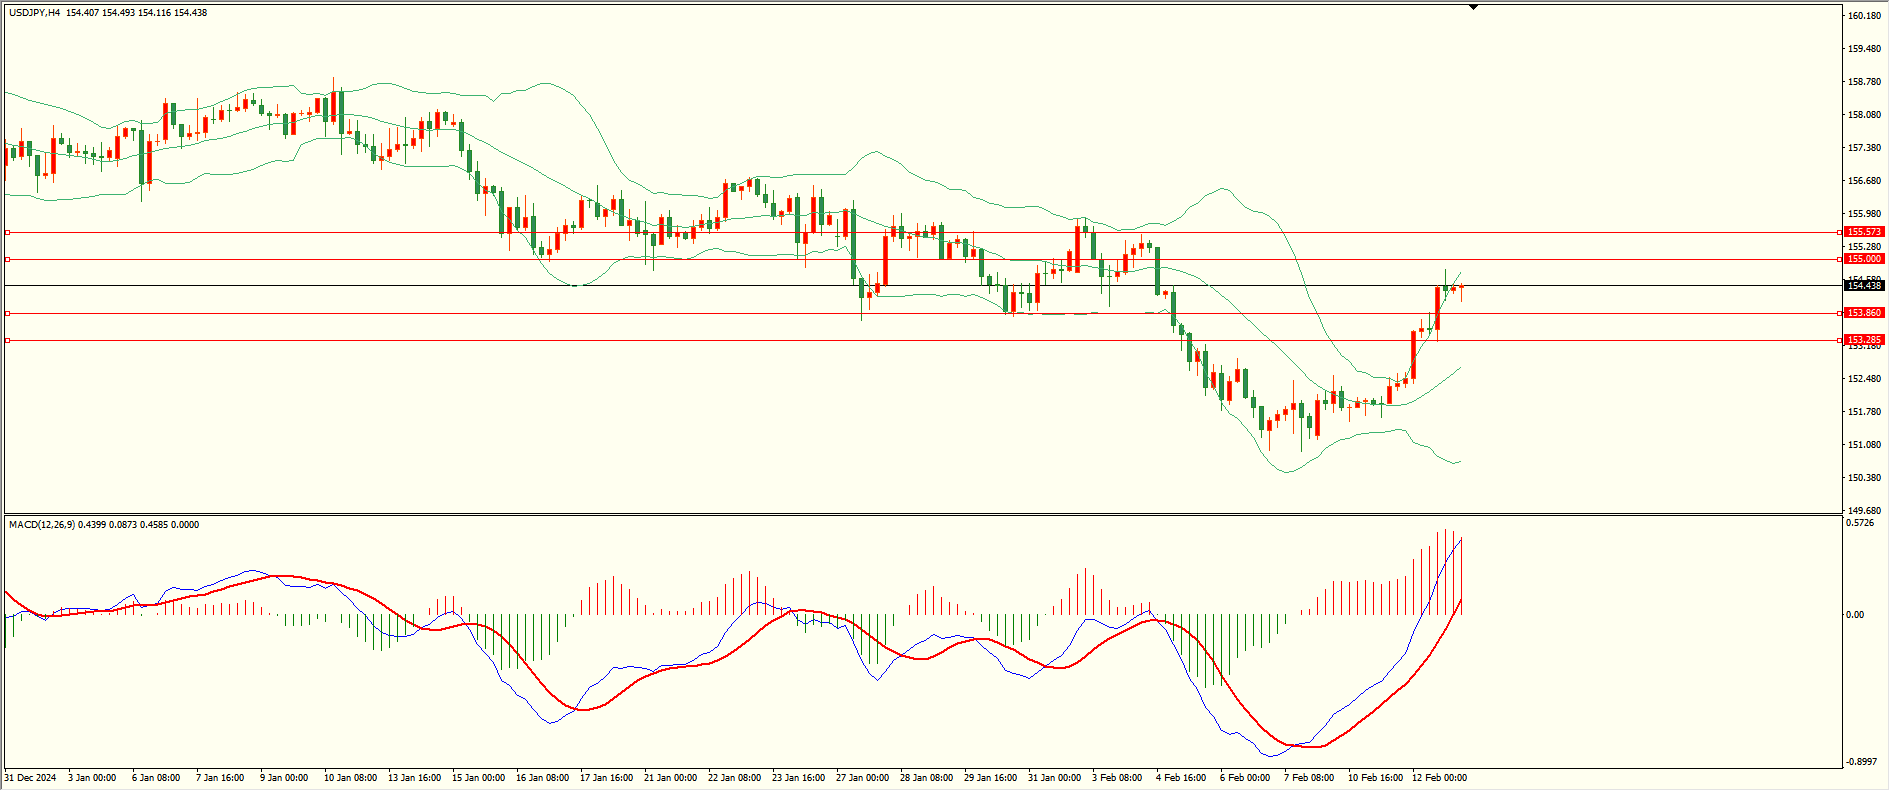
USD/JPY continued to rise after the Asian market opened yesterday, with a slight drop in resistance before hitting the New York session. The daily closing line closed at the upper and lower shadow lines of the big bullish line, and the closing position touched the daily Bollinger Bands. After breaking through, it can open up upward space. From the 4H perspective, the upper and lower Bollinger Bands are expanding, and MACD is running above the zero axis. The main support for the day is 153.85, the second support is 153.20-30, and the upper resistance is 155.00155.55. It is expected to test the first resistance in the short term above the first support.
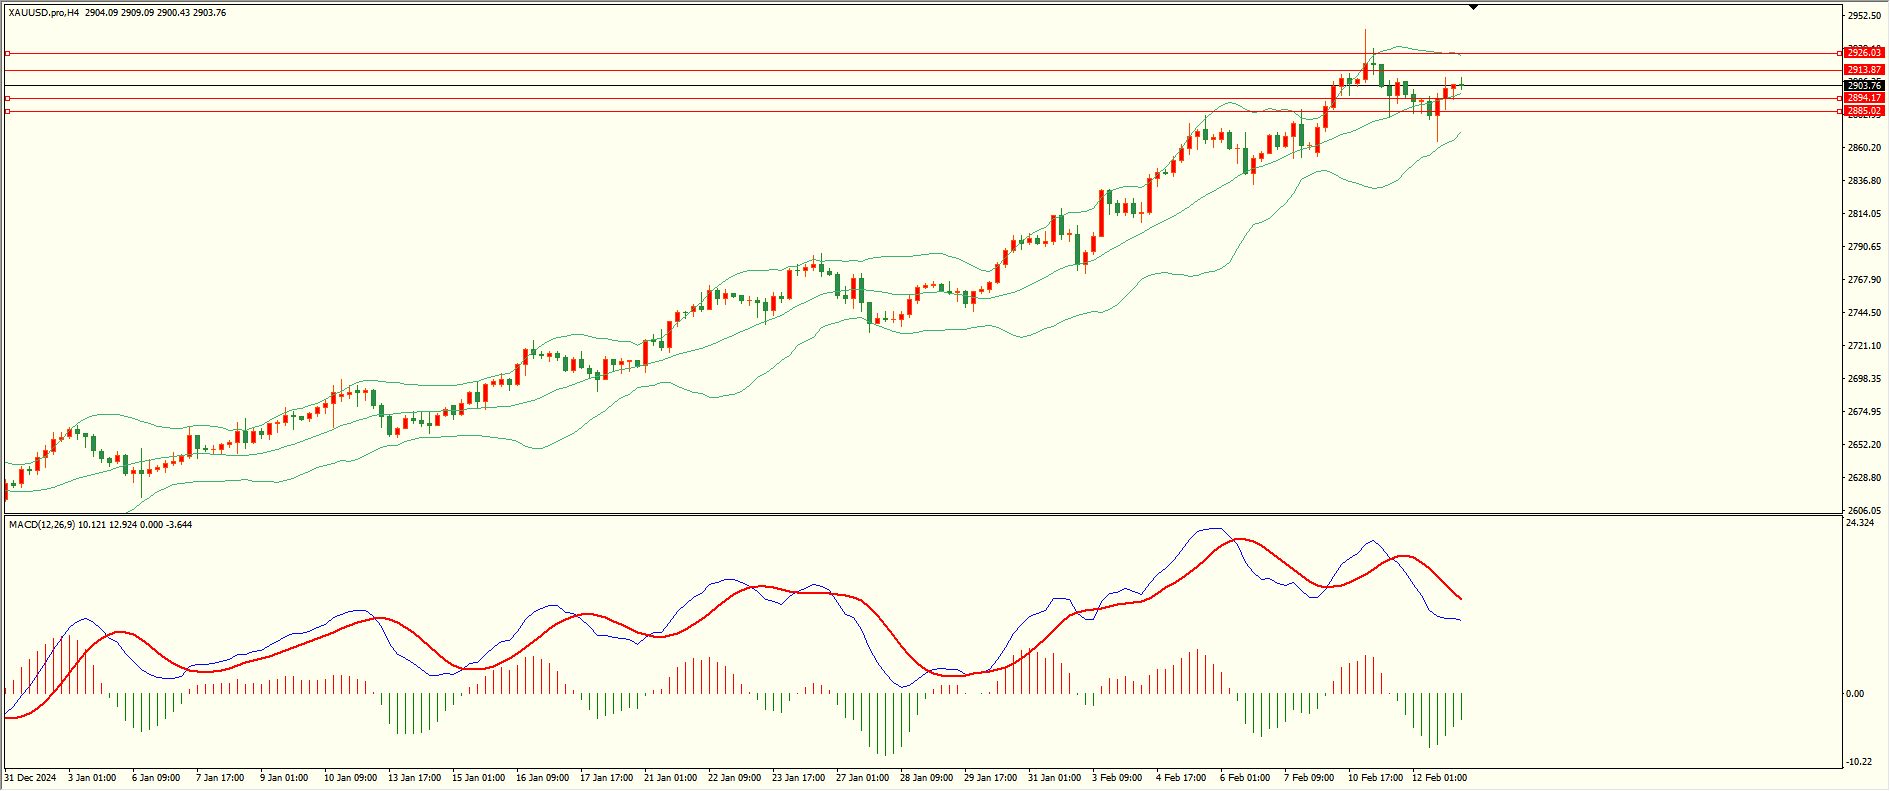
Gold rebounded to the second support yesterday and slightly eased to the first resistance at the close. The daily chart closed with a bullish candlestick above and below the upper and lower shadow lines. From the close, the lower support remained stable, while attention should be paid to the upper resistance area to prevent further volatility. Combined with the 4H chart, the Bollinger Bands were above the zero axis of MACD. The main support for the day was 2894-95, the second support was 2885, and the upper resistance was 29132926. The first support is expected to test the first resistance in the short term before it falls.
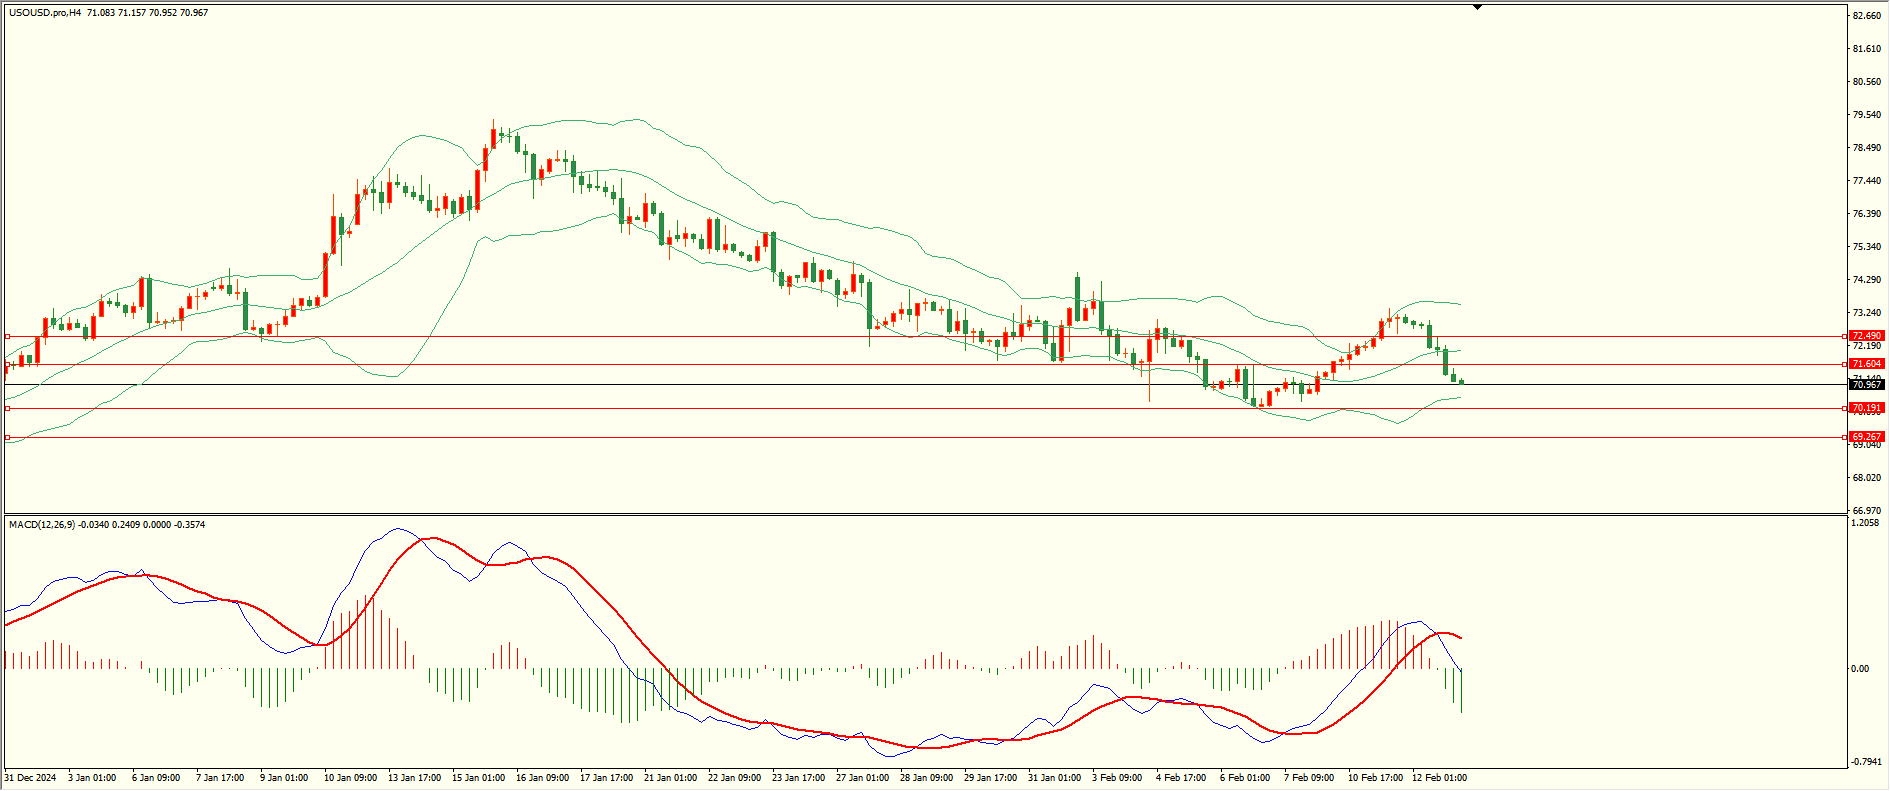
After the Asian market opened yesterday, crude oil fell under pressure and expanded its decline during the New York session. The daily chart closed at a large bearish candlestick, and currently it is adjacent to the front low support area below. It can continue after breaking below. From the 4H perspective, the upper and lower tracks of Bollinger Bands have slightly narrowed, and the MACD zero axis is running near it. The main resistance above the day is 71.60, the second resistance is 72.50, and the support below is 70.20, 69.20-30. It is expected to test the first support in the short term below the first resistance.
Tips:This page came from Internet, which is not standing for FXCUE opinions of this website.
Statement:Contact us if the content violates the law or your rights