Foreign exchange trading analysis: Can the Australian dollar/US dollar break through 0.6280?
On Thursday (February 13th) during the European trading session, the AUD/USD rebounded and fell slightly, mainly due to the impact of rising consumer inflation expectations in Australia in February. Consumer inflation expectations in Australia have risen from 4.0% in January to 4.6%. However, due to the uncertainty of the global economy, the rise of the Australian dollar has been limited. Recently, concerns about potential countermeasures from the United States have once again escalated, leading to a cautious market sentiment.
In addition, the market is still waiting for the release of the Producer Price Index (PPI) in the United States, and further data on US inflation will be of great concern to the market, which may provide support for the US dollar. Overall, the upward potential of the Australian dollar has been suppressed, especially after US President Trump announced a 25% tariff increase.
On the other hand, the expectation of the Reserve Bank of Australia cutting interest rates continues to rise. At present, the cash rate of the Reserve Bank of Australia remains at 4.35%, but the market generally expects the Reserve Bank of Australia to cut interest rates at its February meeting. The market currently estimates a 95% probability of a rate cut to 4.10%. This also indicates that there is uncertainty in the recovery of the Australian economy, and inflationary pressures have eased to some extent. The Reserve Bank of Australia may adopt a more loose monetary policy.
Technical analyst interpretation:
From the current daily chart of AUD/USD, the price is currently maintained around 0.6265, oscillating and consolidating around multiple moving averages (MA) on the daily chart. Overall, the short-term trend exhibits certain oscillation characteristics, with prices fluctuating within the interweaving area of multiple moving averages, indicating a lack of clear direction in the market and a relatively balanced buying and selling force.
Average analysis:
Short term moving averages (MA9 and MA14): Currently, prices remain near MA9 and MA14, and are not far from these moving averages, which may face some downward pressure.
Mid term moving average (MA50): Prices are also located near MA50, which is an important support and resistance line. If the price breaks below MA50 (about 0.6258), it may further test the support area below.
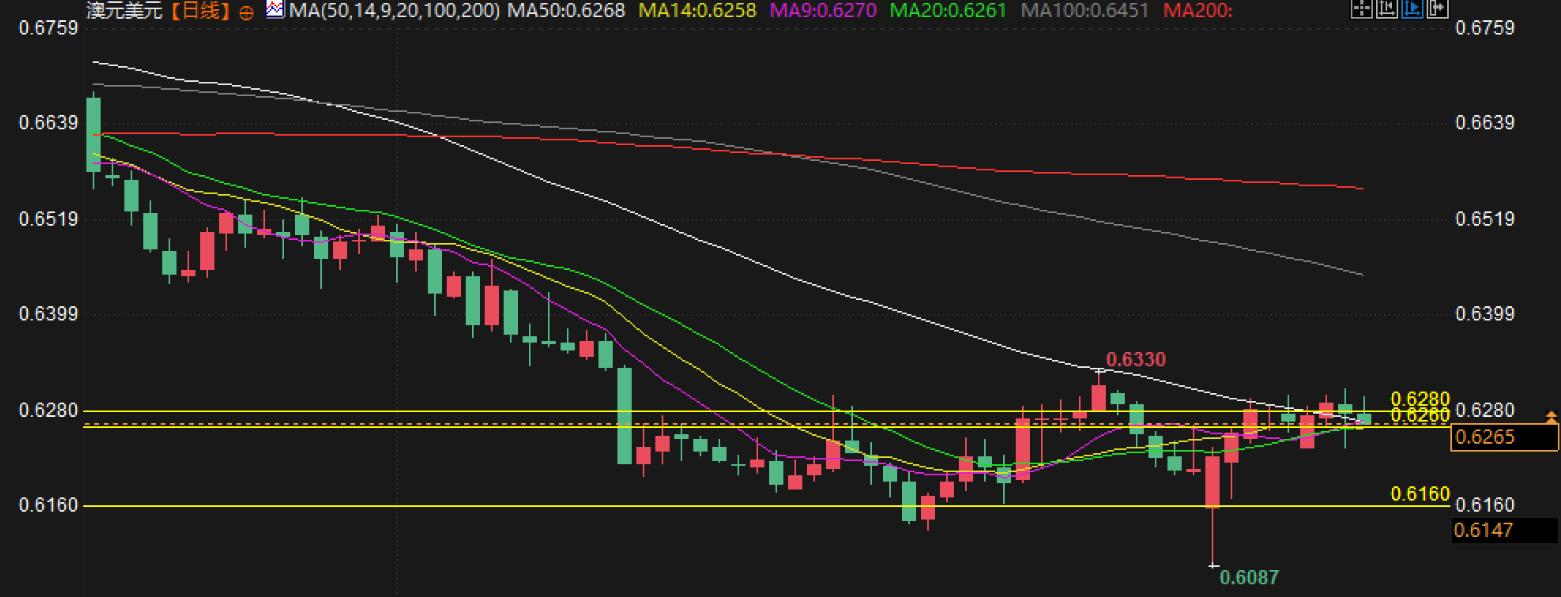
Long term moving averages (MA100 and MA200): The long-term moving averages are relatively far apart and currently do not have a direct impact on short-term prices.
RSI indicator:
RSI (14) is currently at 50.14, in the neutral range. RSI remains above 50, indicating a slight bullish sentiment in the market, but not strongly. If the RSI continues to remain above 50, it may indicate that the price will maintain a volatile consolidation or slowly rise. If RSI falls below 50, there may be a pullback.
MACD indicator:
The DIF and DEA lines of MACD are very close, and the DIF line is slightly higher than the DEA line, indicating that the market momentum is still weak and the market may be in a volatile state. The MACD bar chart shows relatively weak short-term momentum and no obvious bullish or bearish signals.
Price trend analysis:
The current price fluctuates within the range of 0.6260 to 0.6280, with 0.6280 being the recent high point. Breaking through this level may further push the price up to the resistance level around 0.6330.
If the price breaks through the current support level of 0.6260, the next support level may be around 0.6160. If further down, 0.6160 is a key support level, and falling below this level may trigger greater downward pressure.
Summary:
At present, the Australian dollar/US dollar is in a period of consolidation and there is no clear trend in the short term. The price fluctuates within the moving average range, with an RSI around 50, indicating relatively neutral market sentiment. MACD shows insufficient short-term momentum and a lack of clear direction in the market. In the short term, prices may fluctuate and consolidate between 0.6260 and 0.6280. If it breaks through 0.6280, the price may continue to rise to 0.6330. If it falls below 0.6260, it may rebound to 0.6160.
Tips:This page came from Internet, which is not standing for FXCUE opinions of this website.
Statement:Contact us if the content violates the law or your rights