Technical Analysis: Spot Gold May Fall to $3220
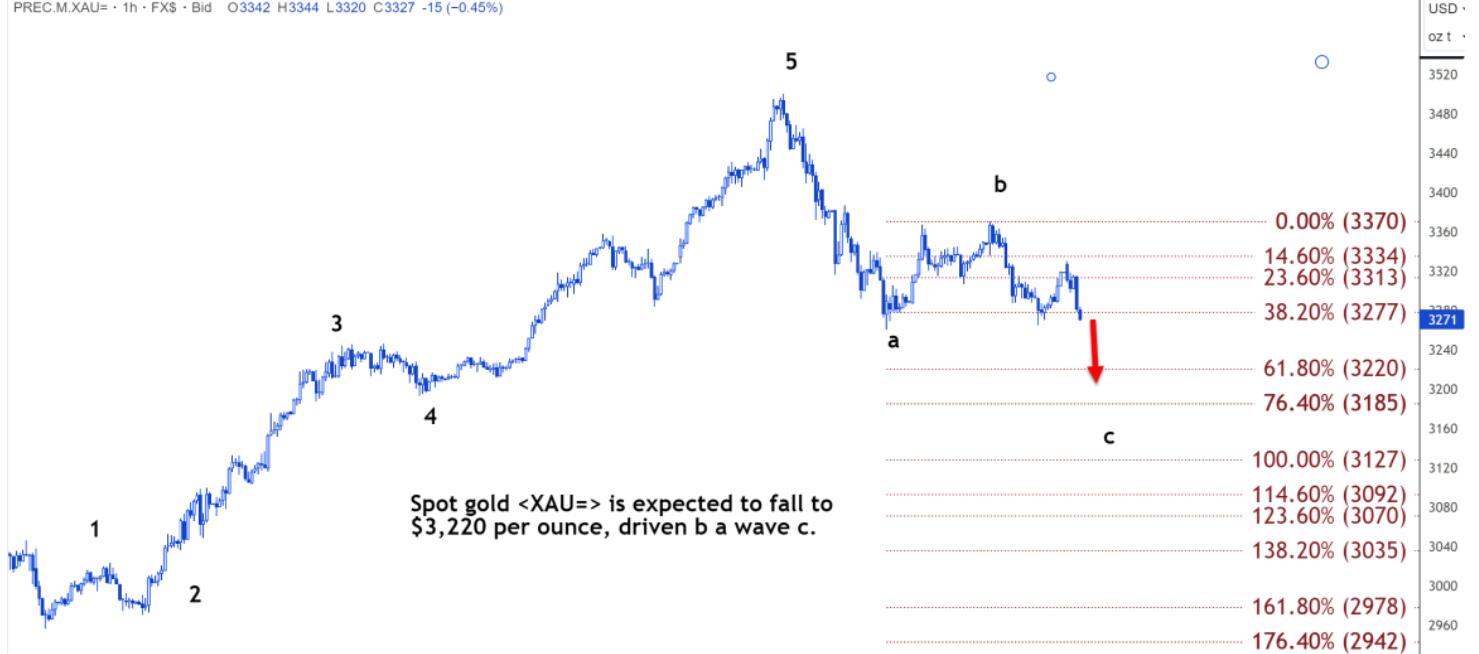
Analysts point out that the forecast analysis of this wave indicates a broad target zone of 3127to3127to3220. formed by the 100% and 61.8% levels.
A weaker c-wave may end near 3220.whileastrongerc−wavecouldextendto3220.whileastrongerc−wavecouldextendto3127. The resistance level is near 3313.andabreakthroughofthisresistancelevelmayleadtoanincreaseto3313.andabreakthroughofthisresistancelevelmayleadtoanincreaseto3370.
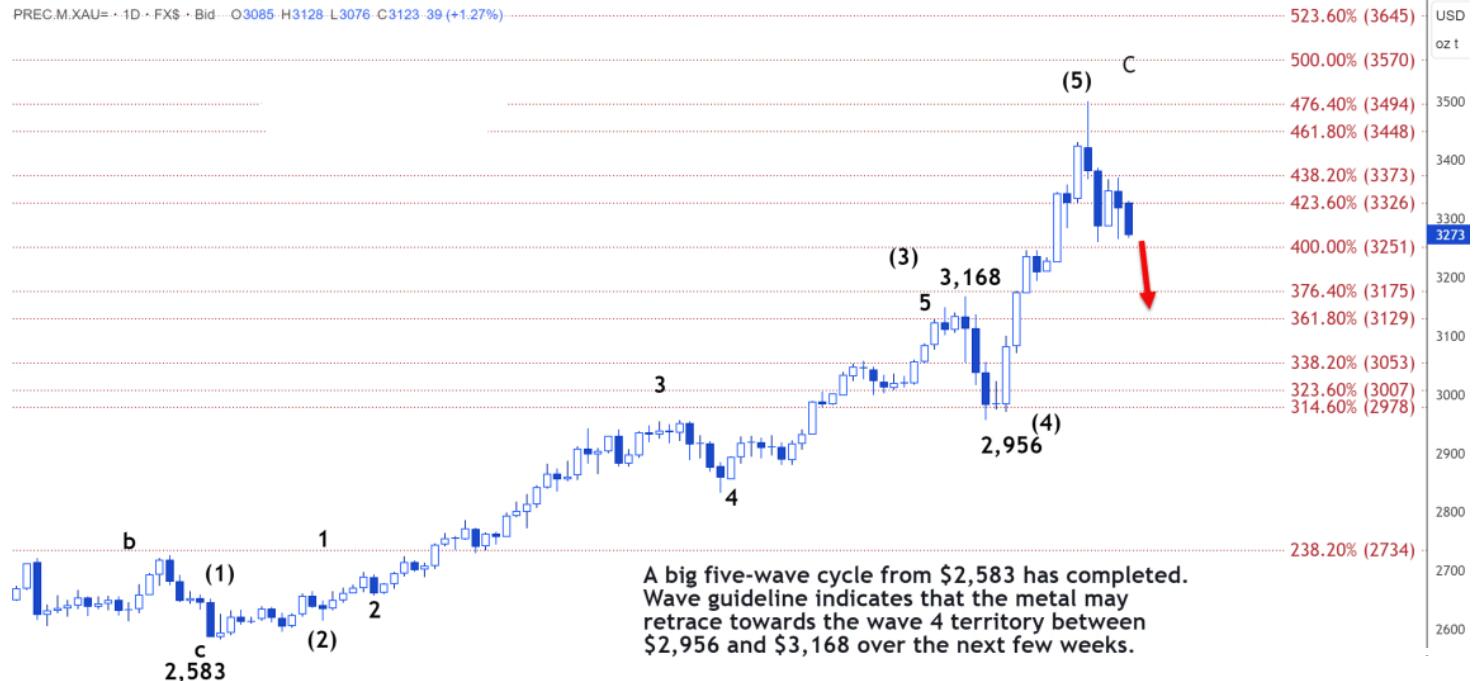
On the daily chart, the five-wave large cycle starting from 2583hasbeencompleted.Thewaveguidanceindicatesthatgoldpricesmayretracetothefourthwavezonebetween2583hasbeencompleted.Thewaveguidanceindicatesthatgoldpricesmayretracetothefourthwavezonebetween2956 and $3168 within the next one to two weeks.
Since the market fell from its high of $3500 on April 22. only a small positive candlestick has formed. This combination of candlestick patterns symbolizes intense bearish sentiment.
Tips:This page came from Internet, which is not standing for FXCUE opinions of this website.
Statement:Contact us if the content violates the law or your rights